COVID-19 Mobile Ad Performance Tracker
Updated April 21, 2020
MAPT tracks weekly changes across several key mobile ad performance KPIs. Make sure to bookmark this page and check back weekly for the most up-to-date information.
This week’s takeaways:
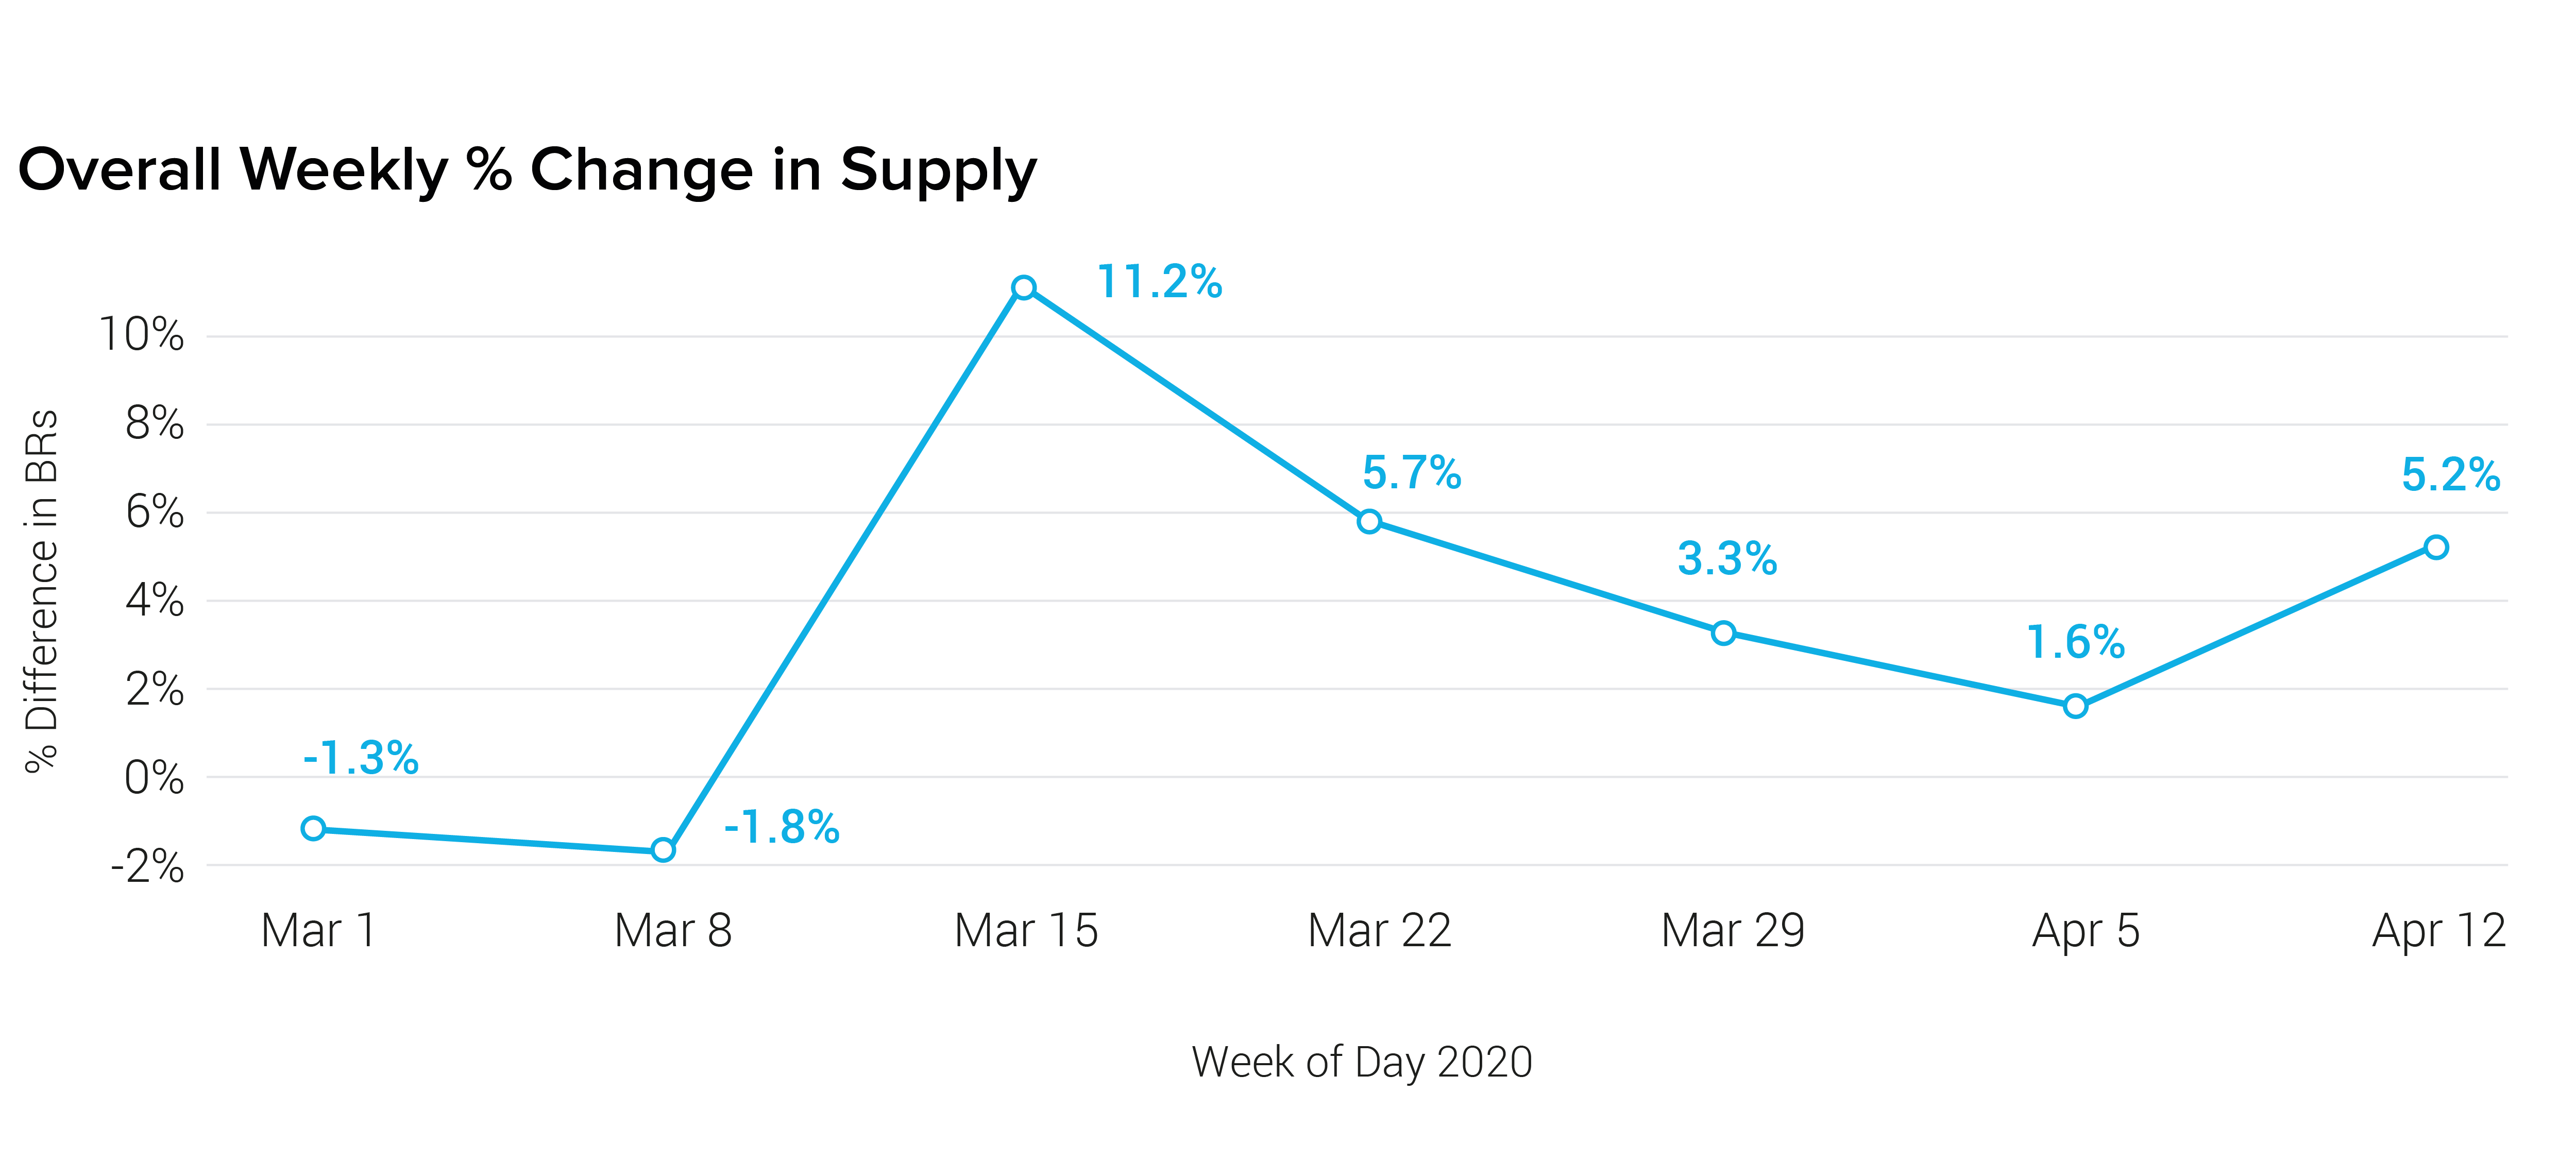
- We saw another increase in available supply, globally (+5.2%). This is the fifth consecutive week where the available supply pool grew. It is also the second straight week that the largest supply increase came from North America (+7.8%).
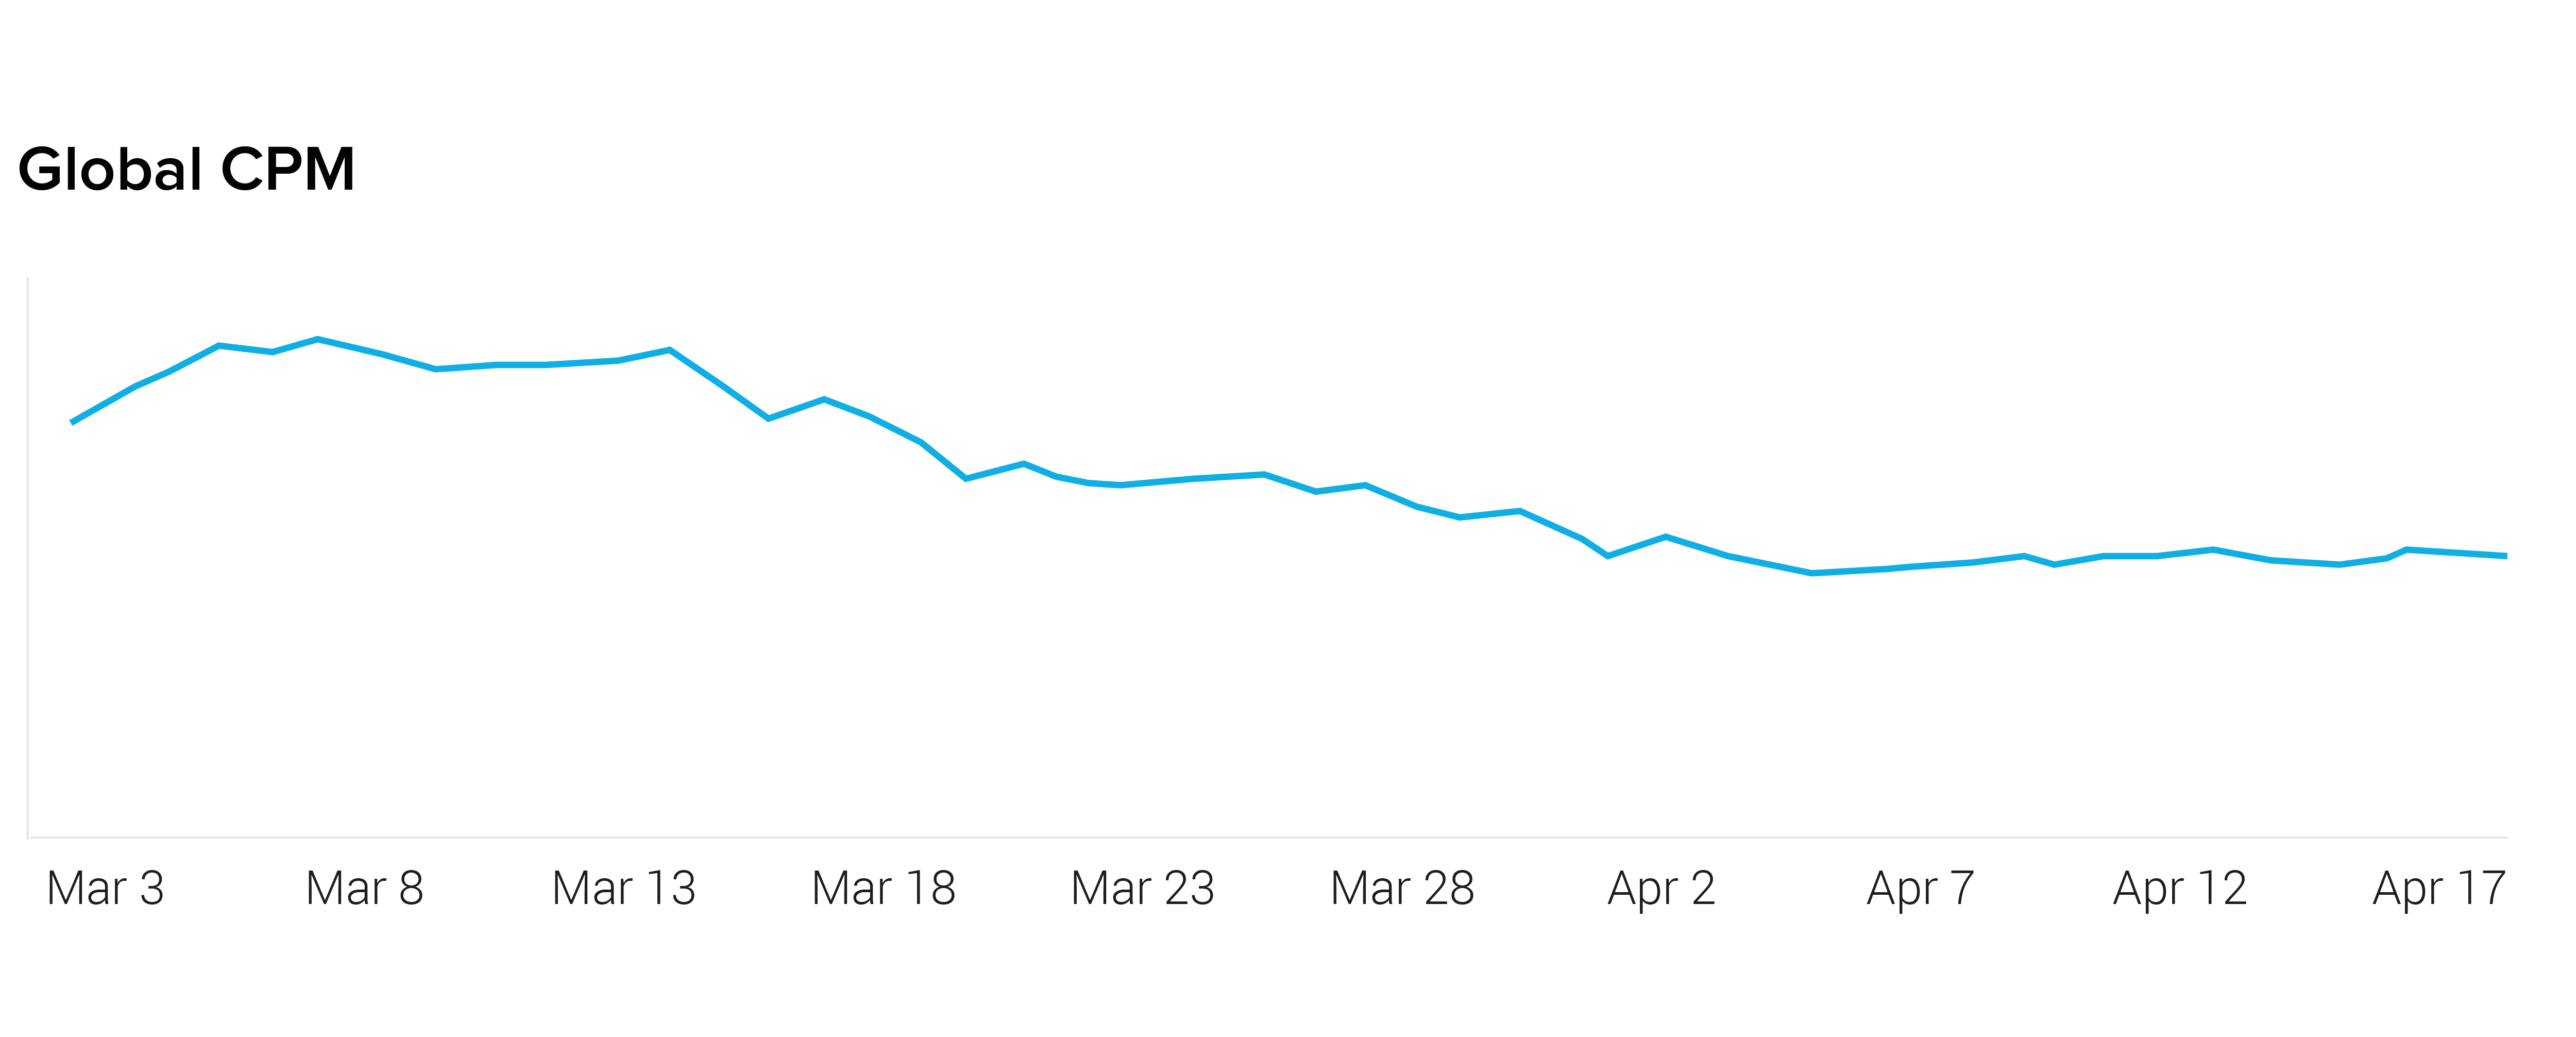
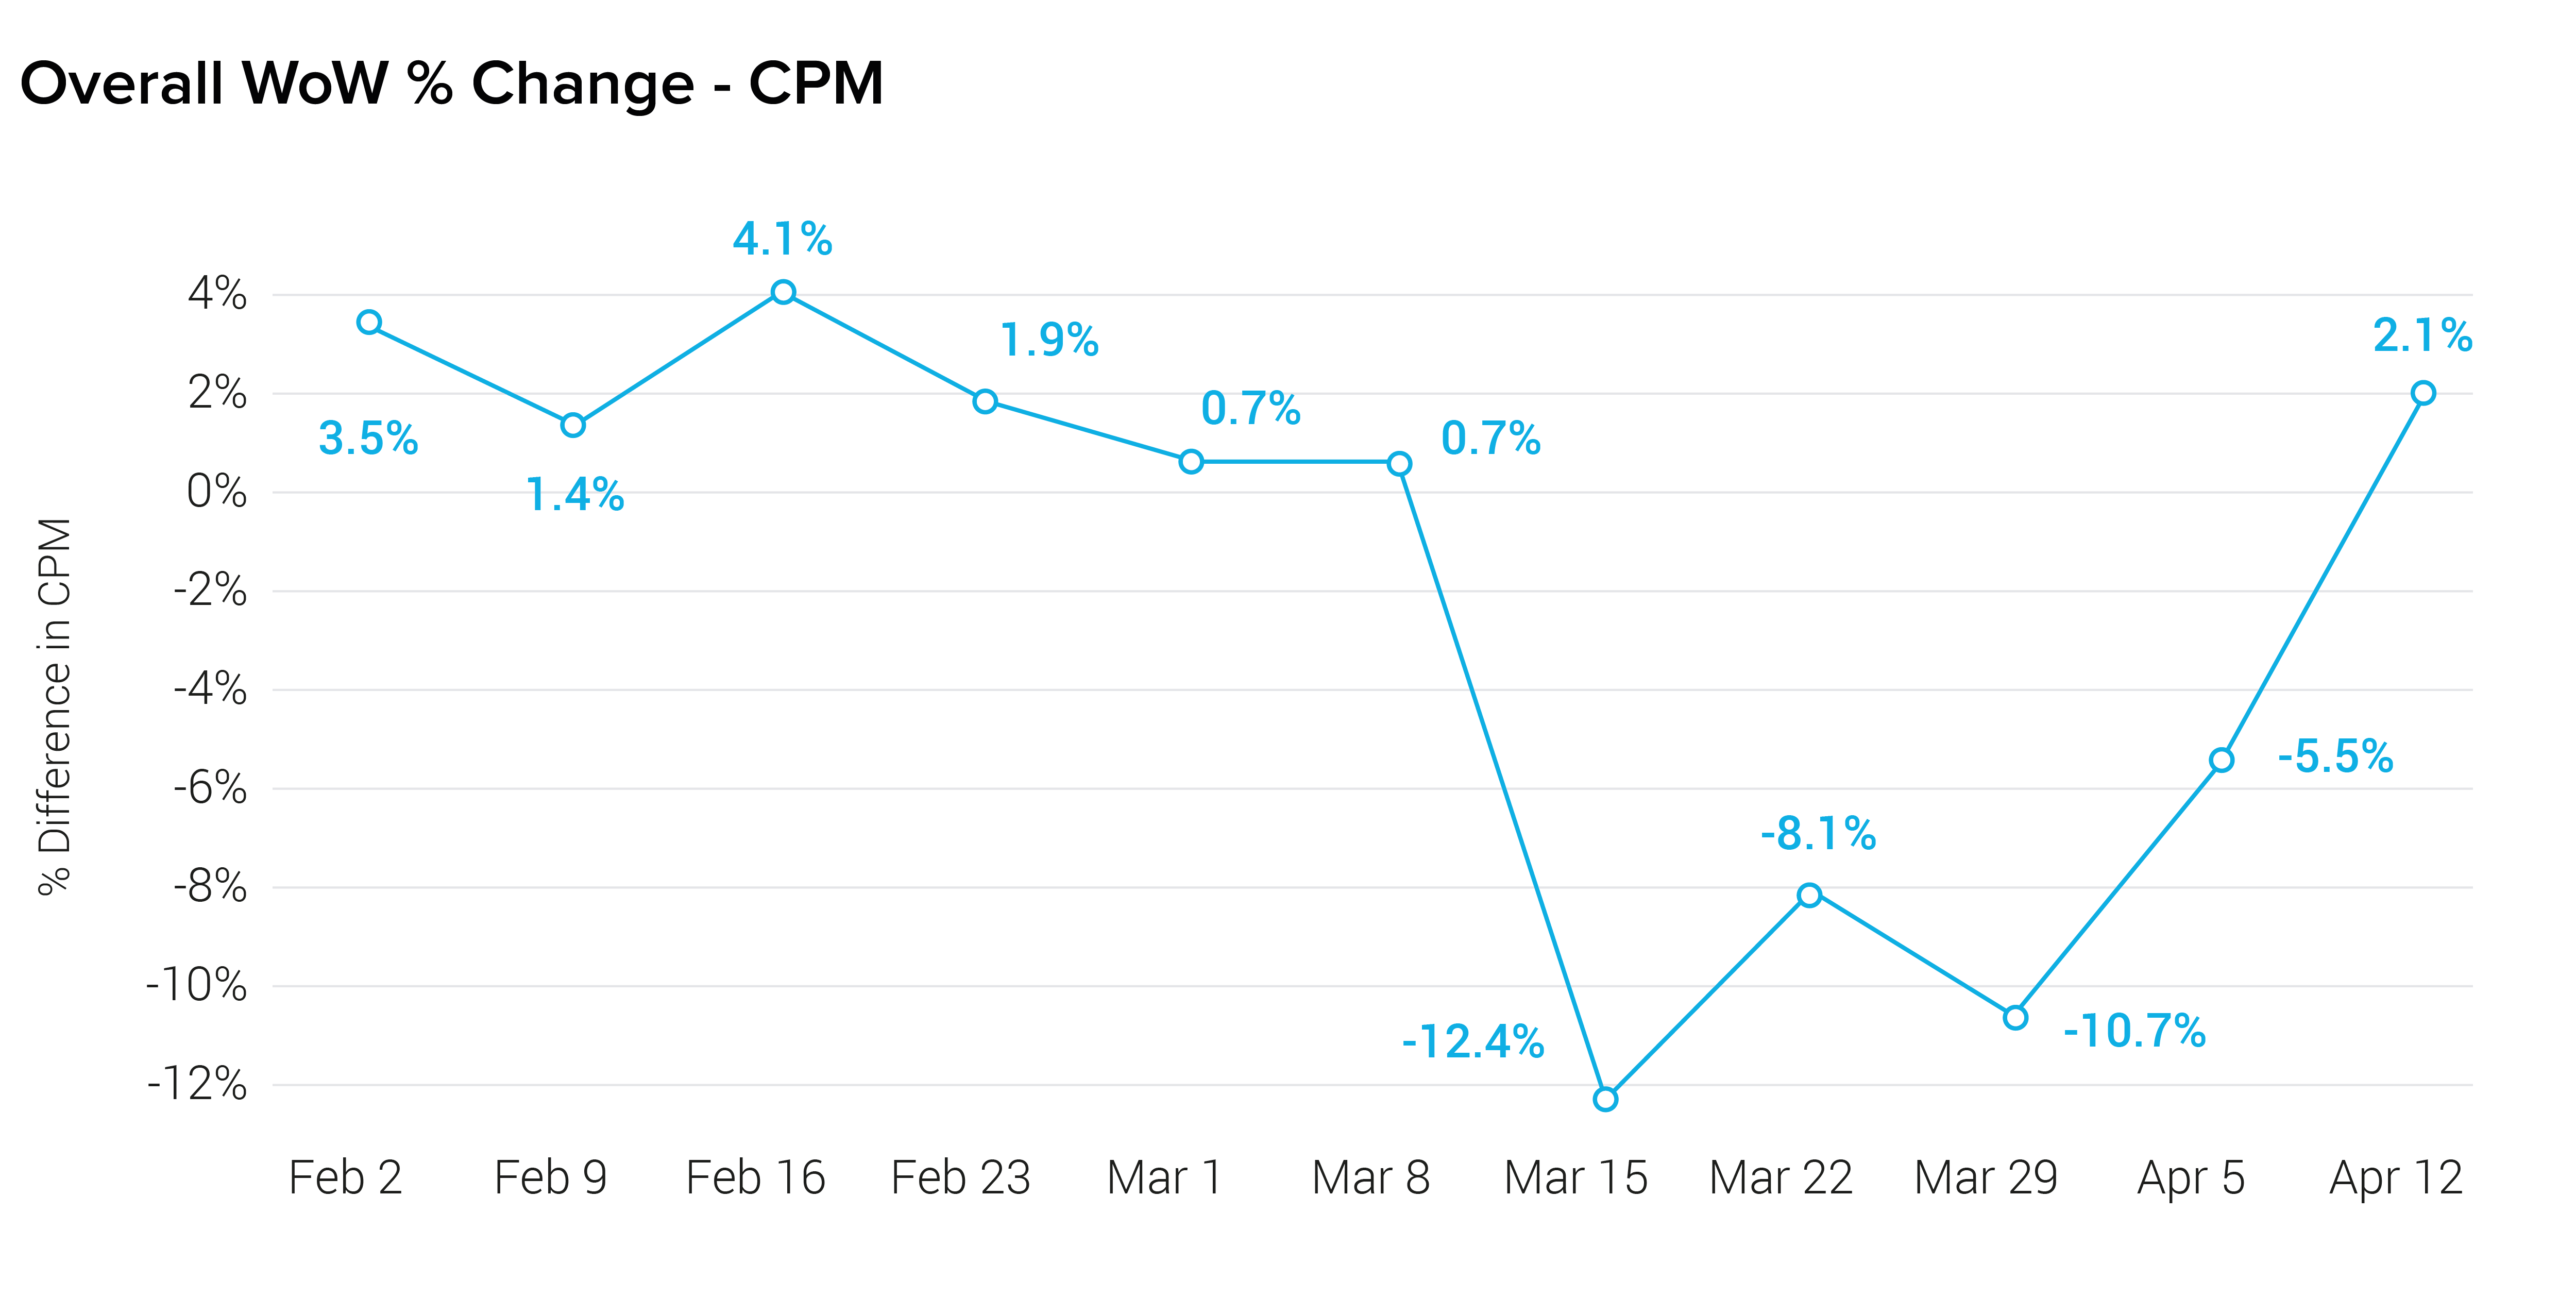
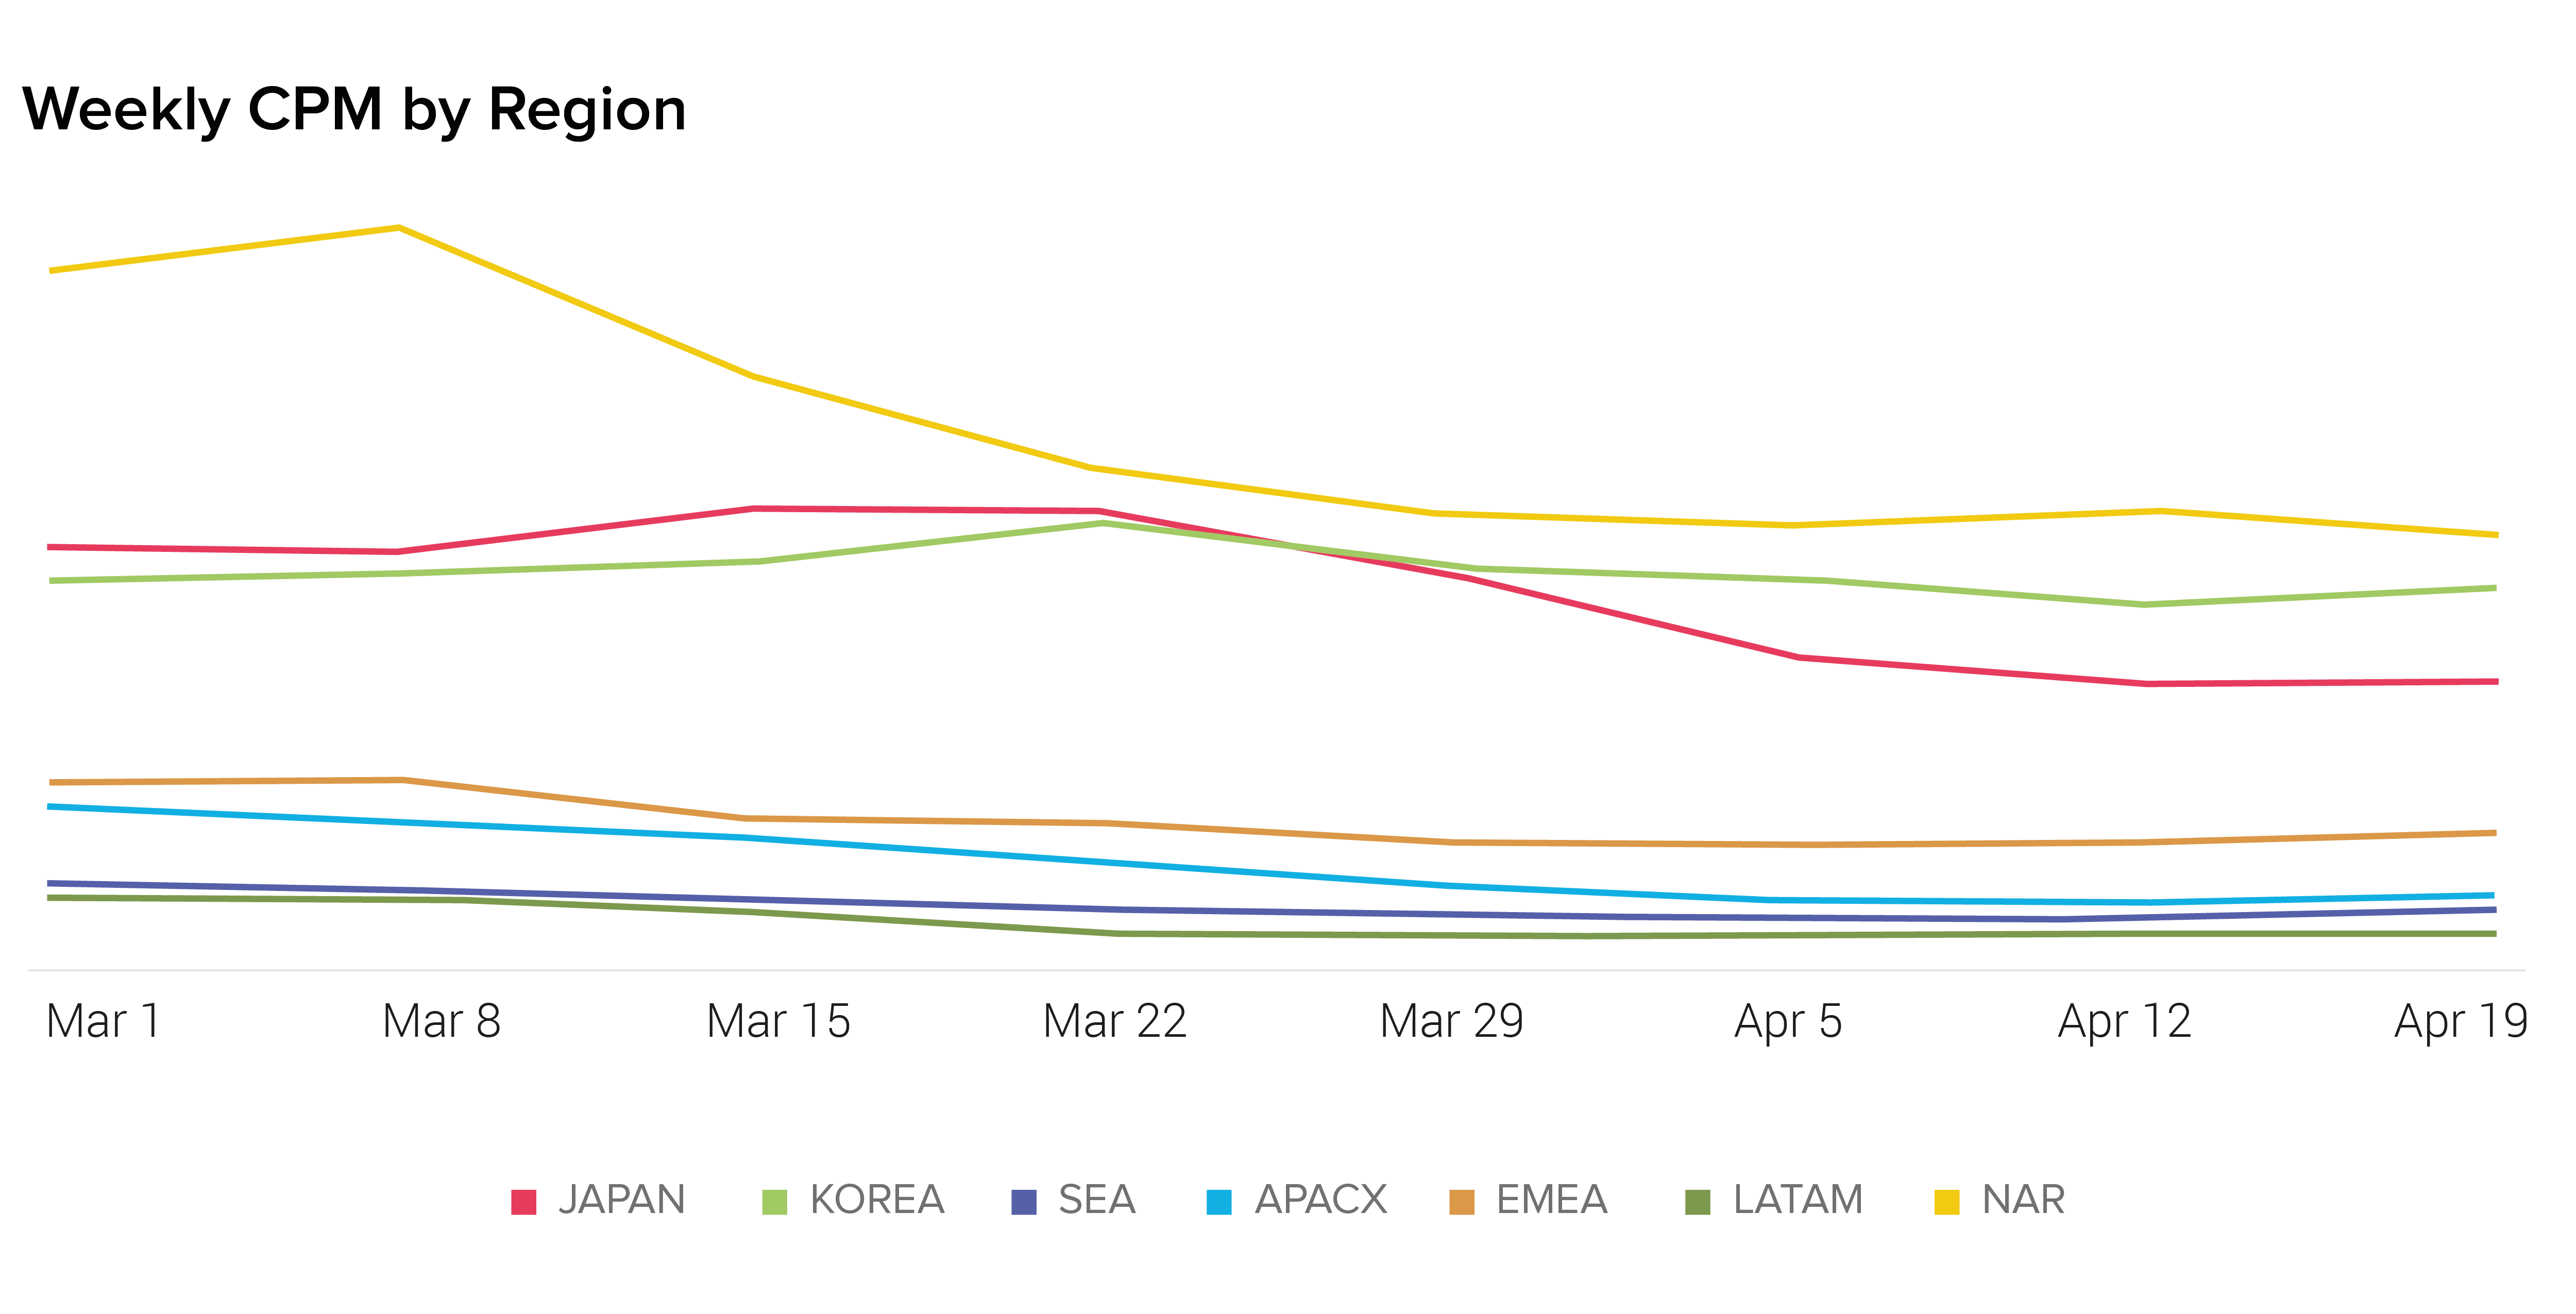
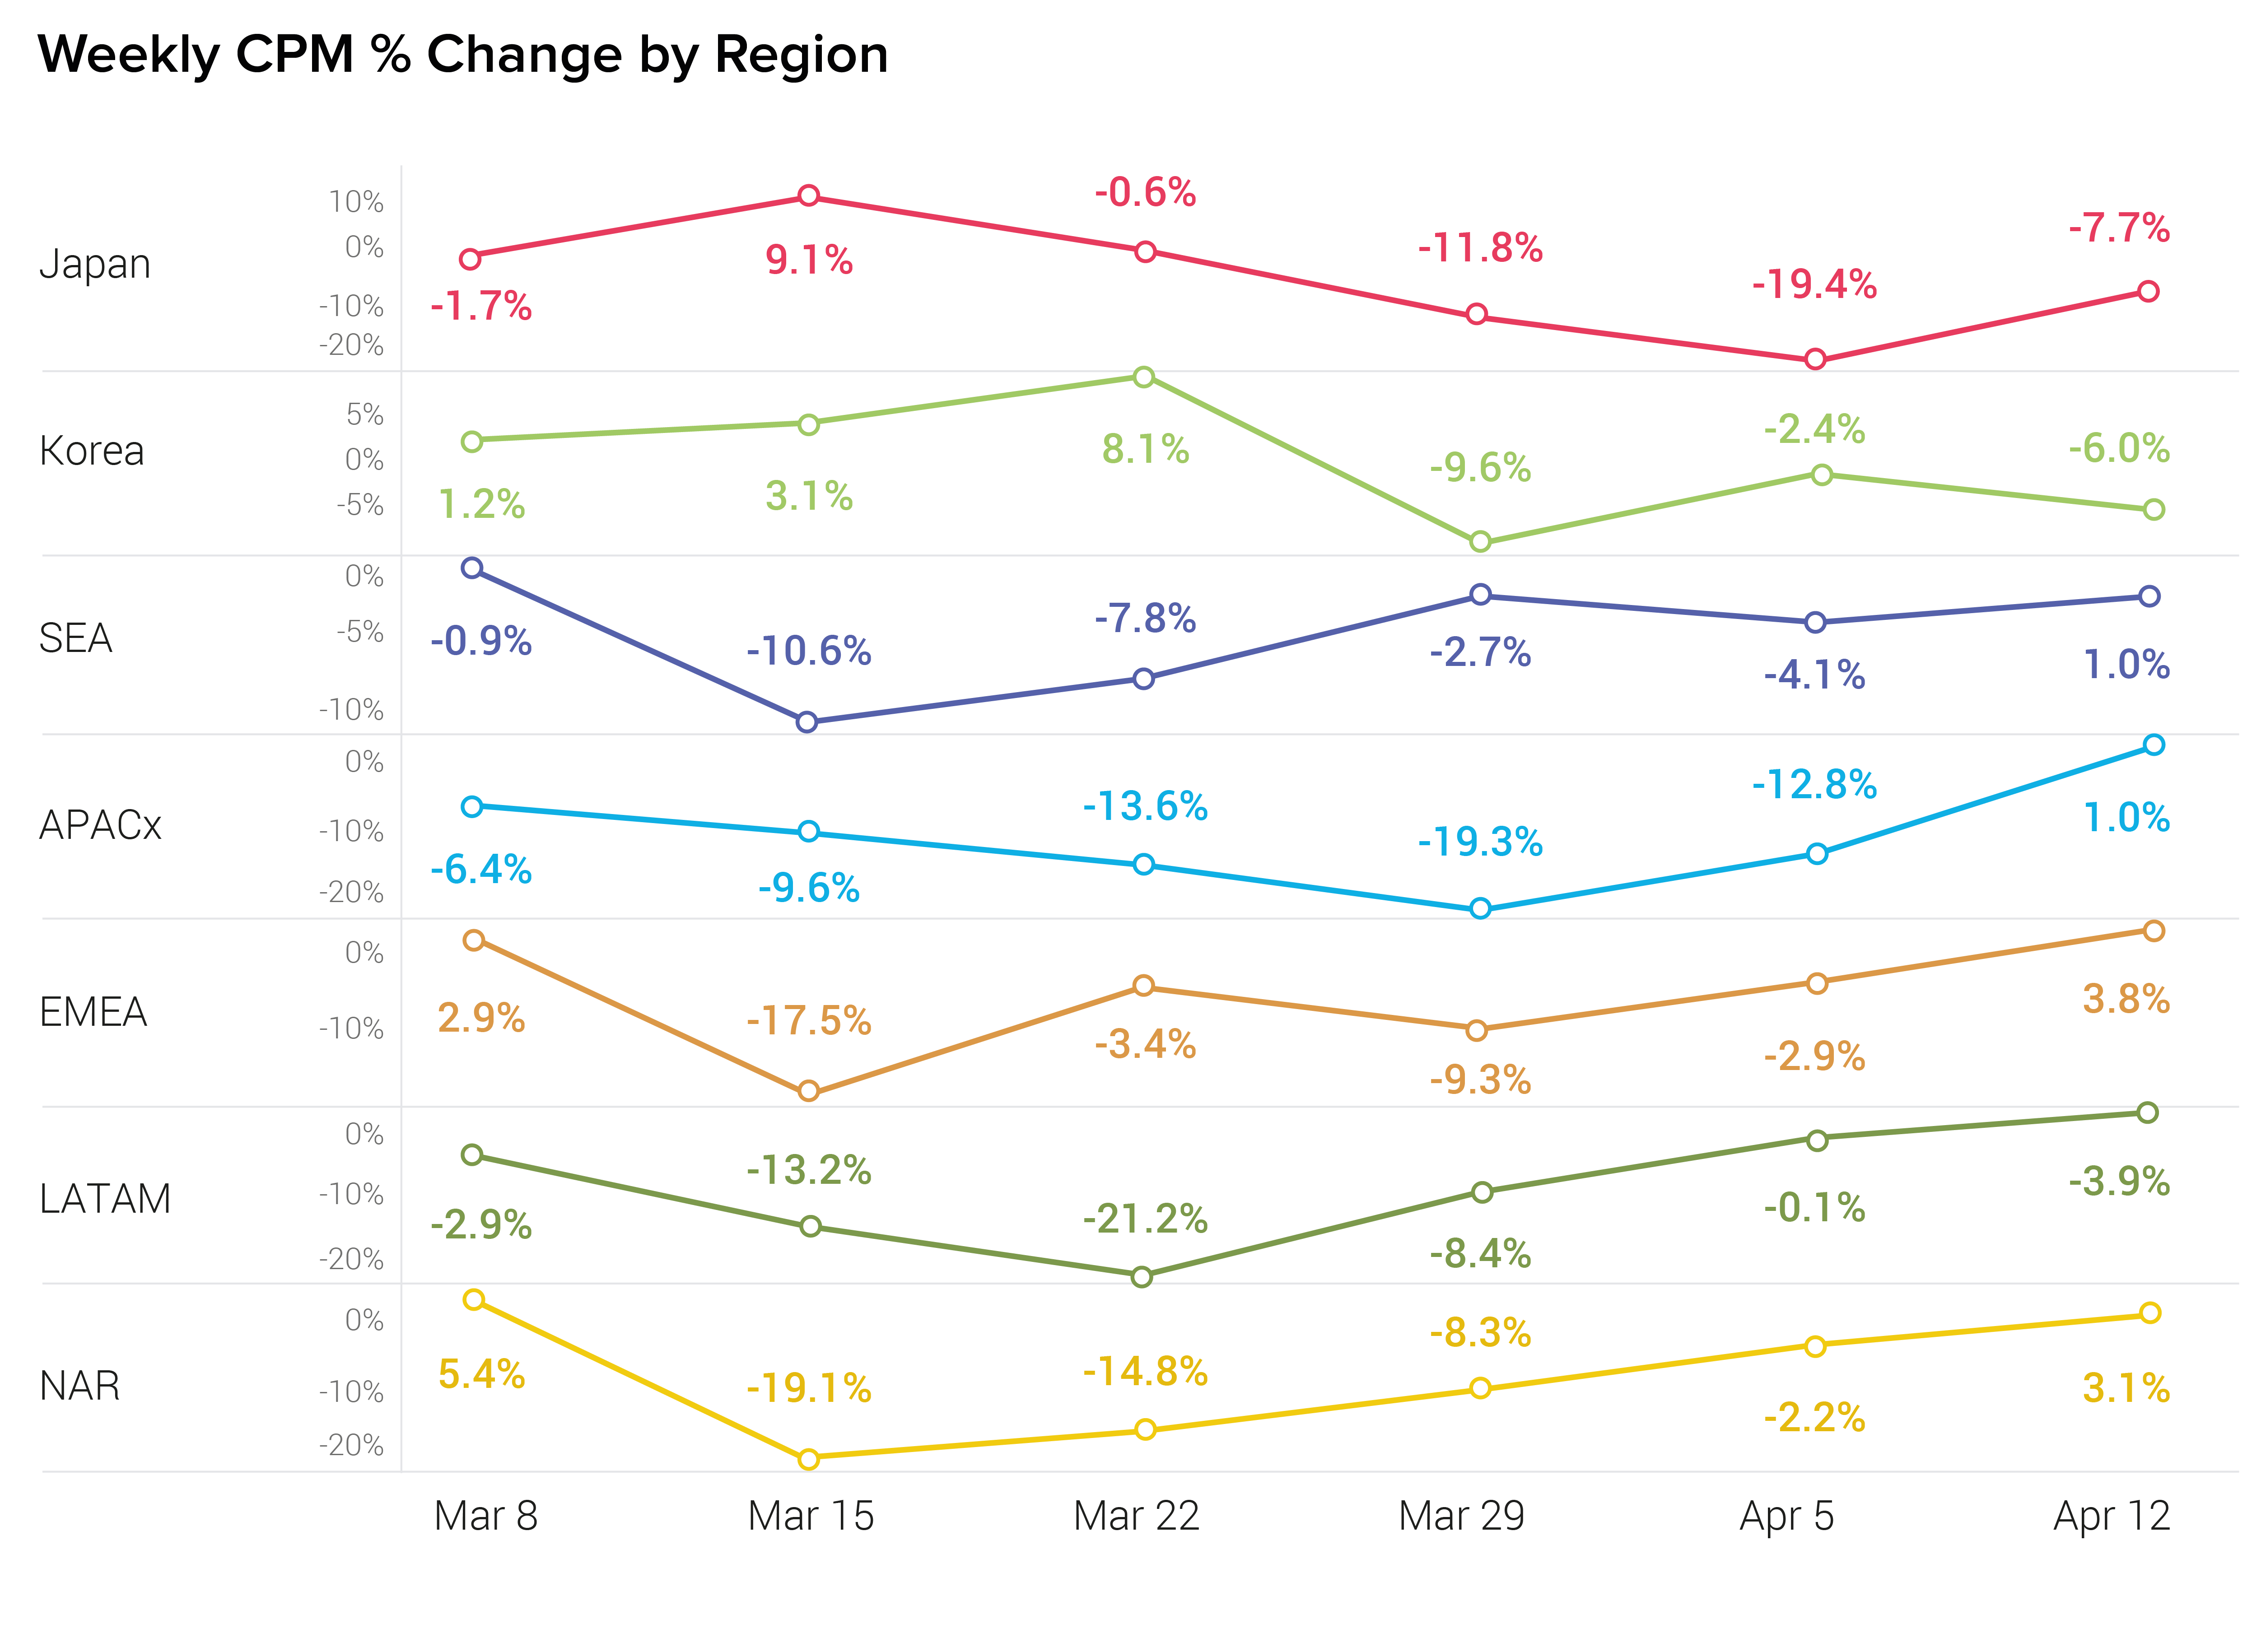
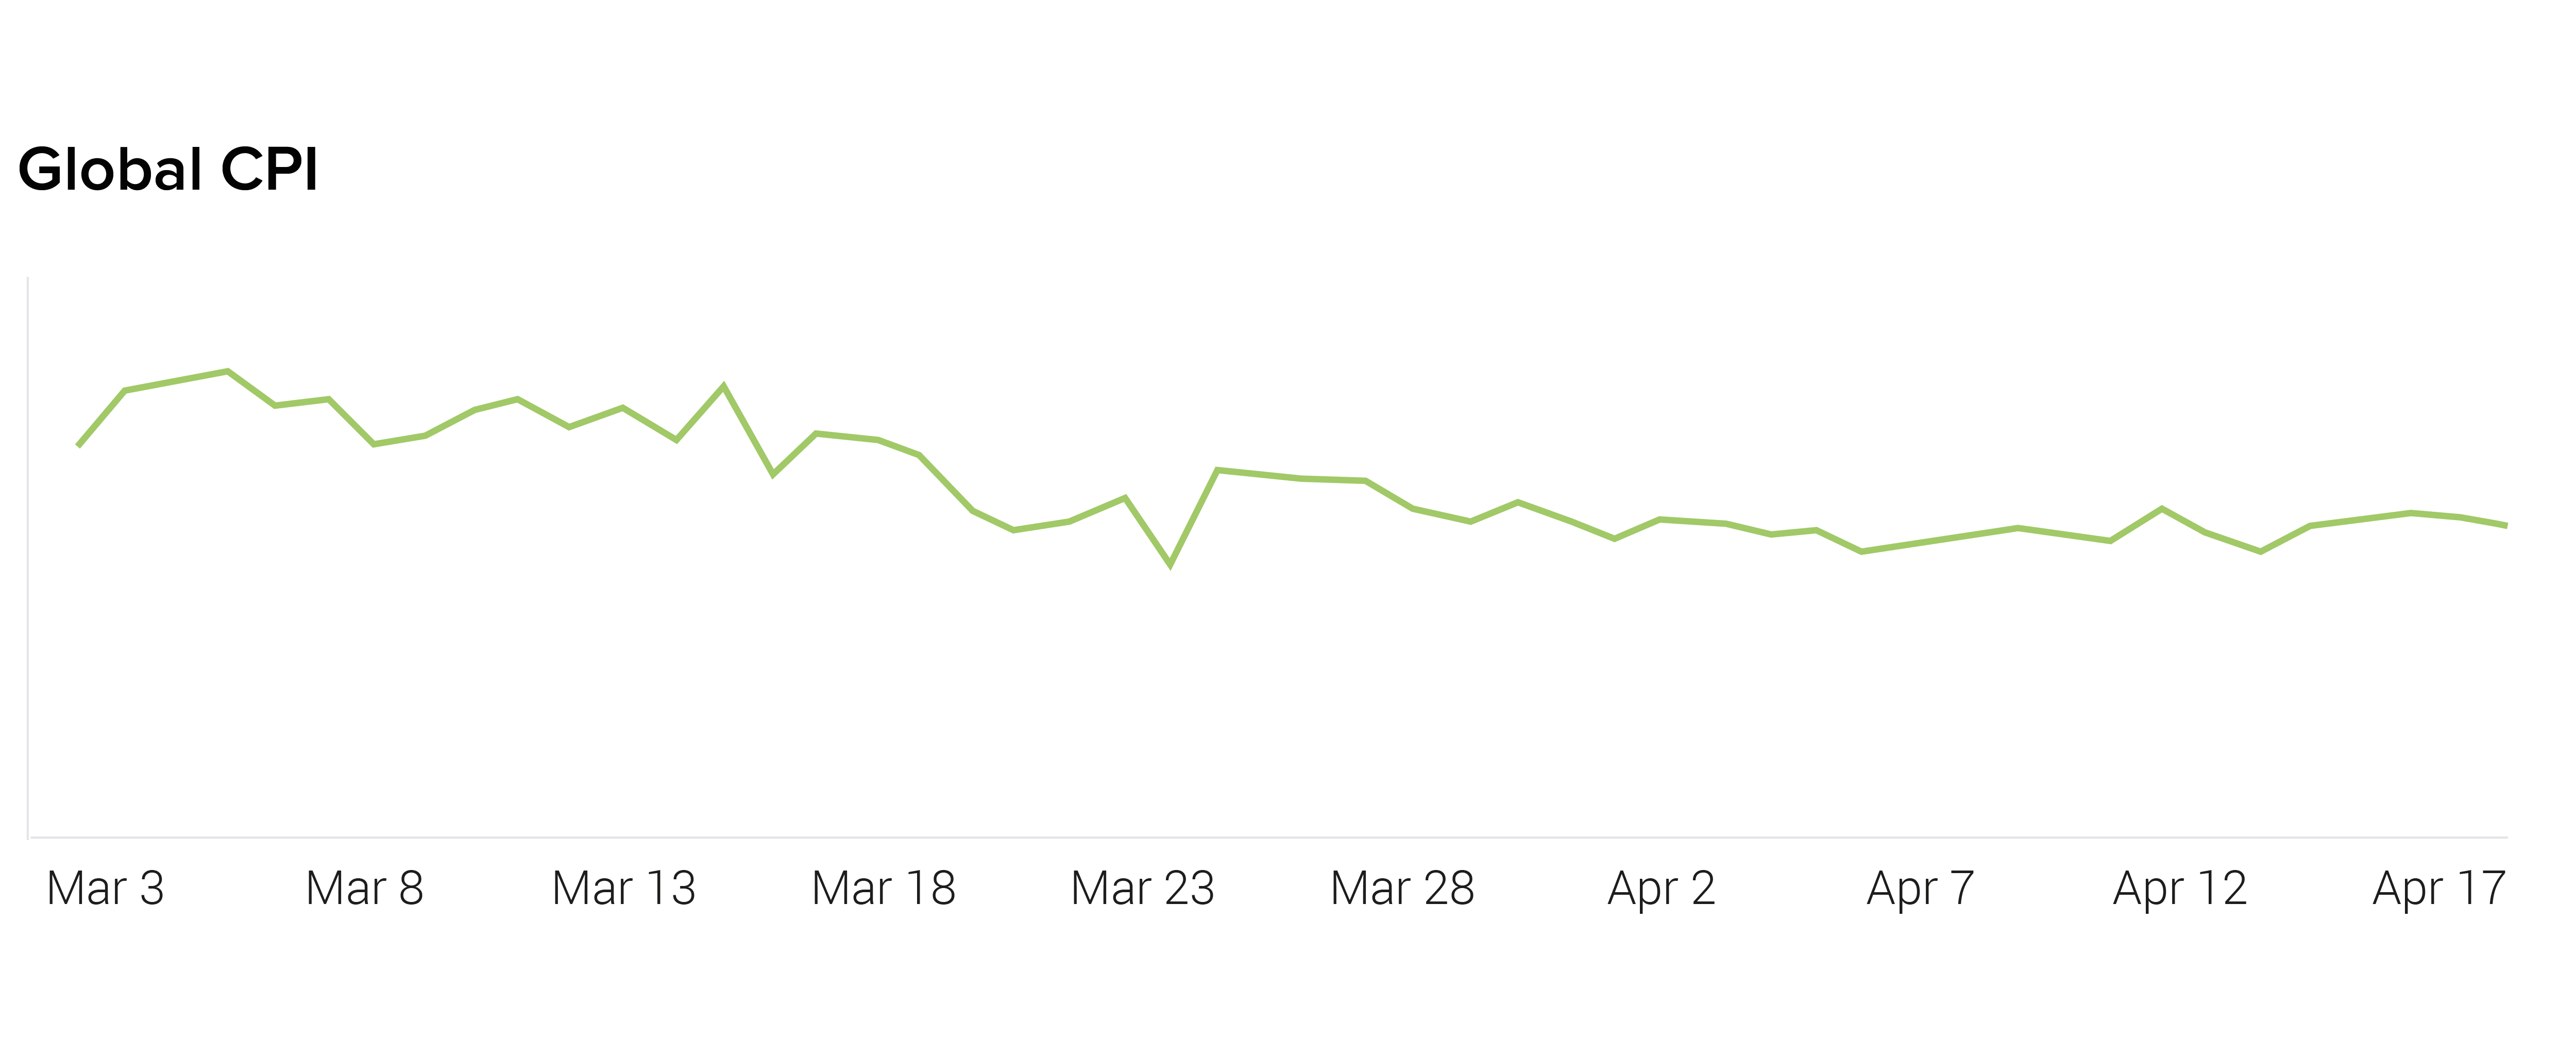
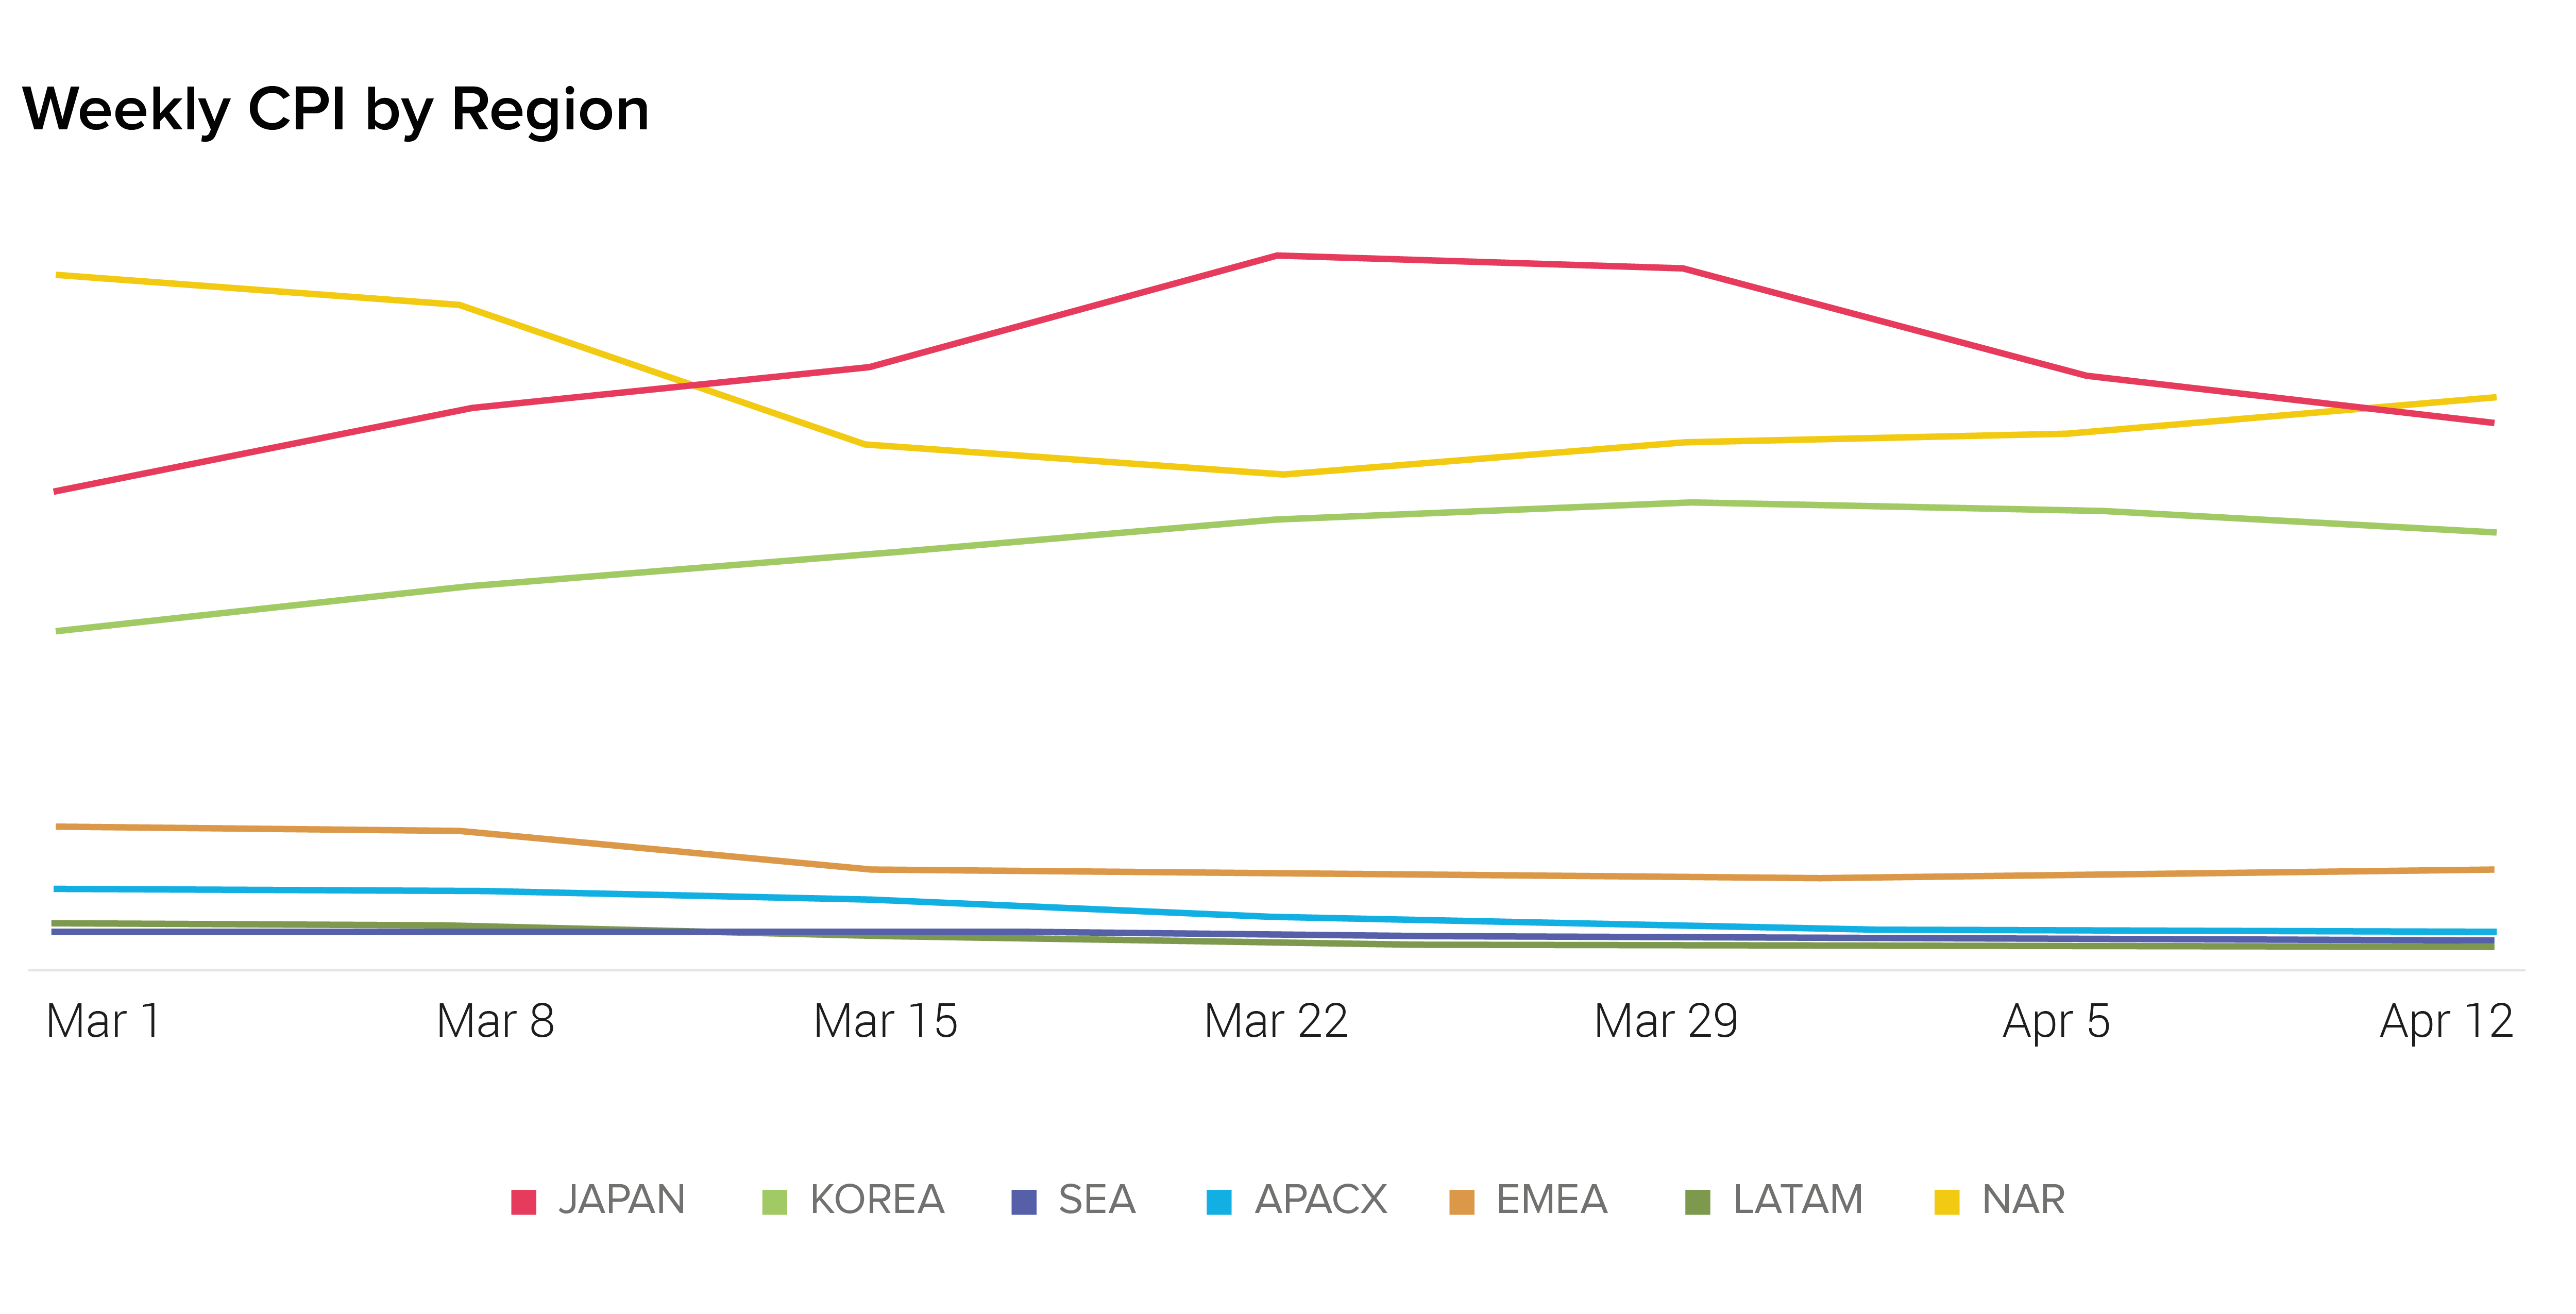
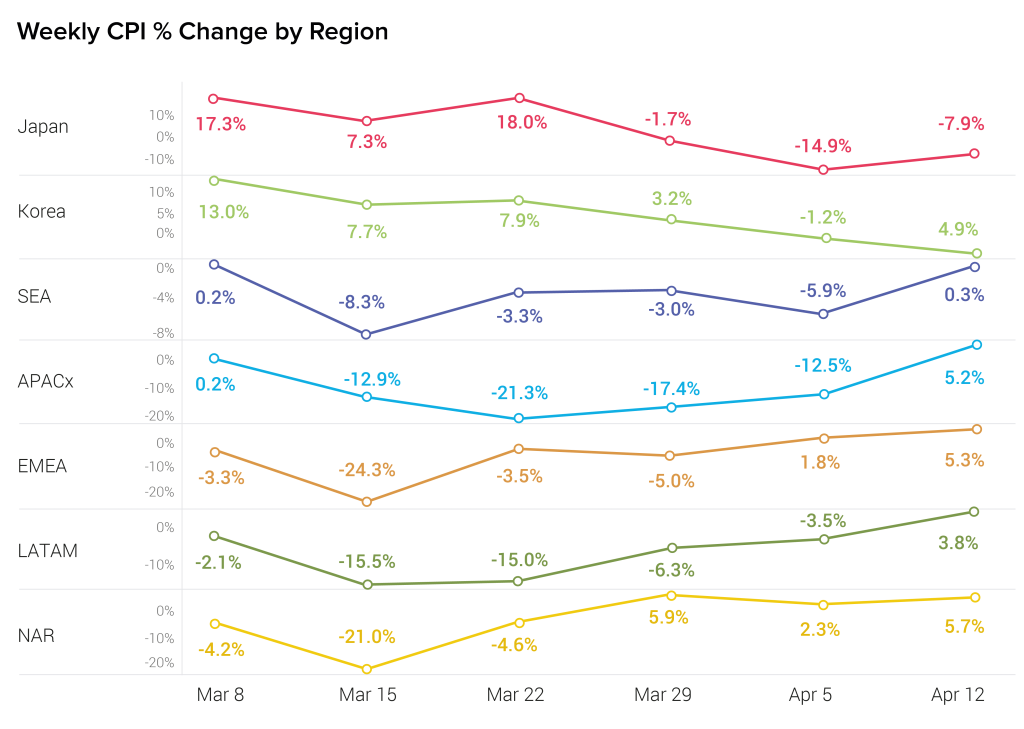
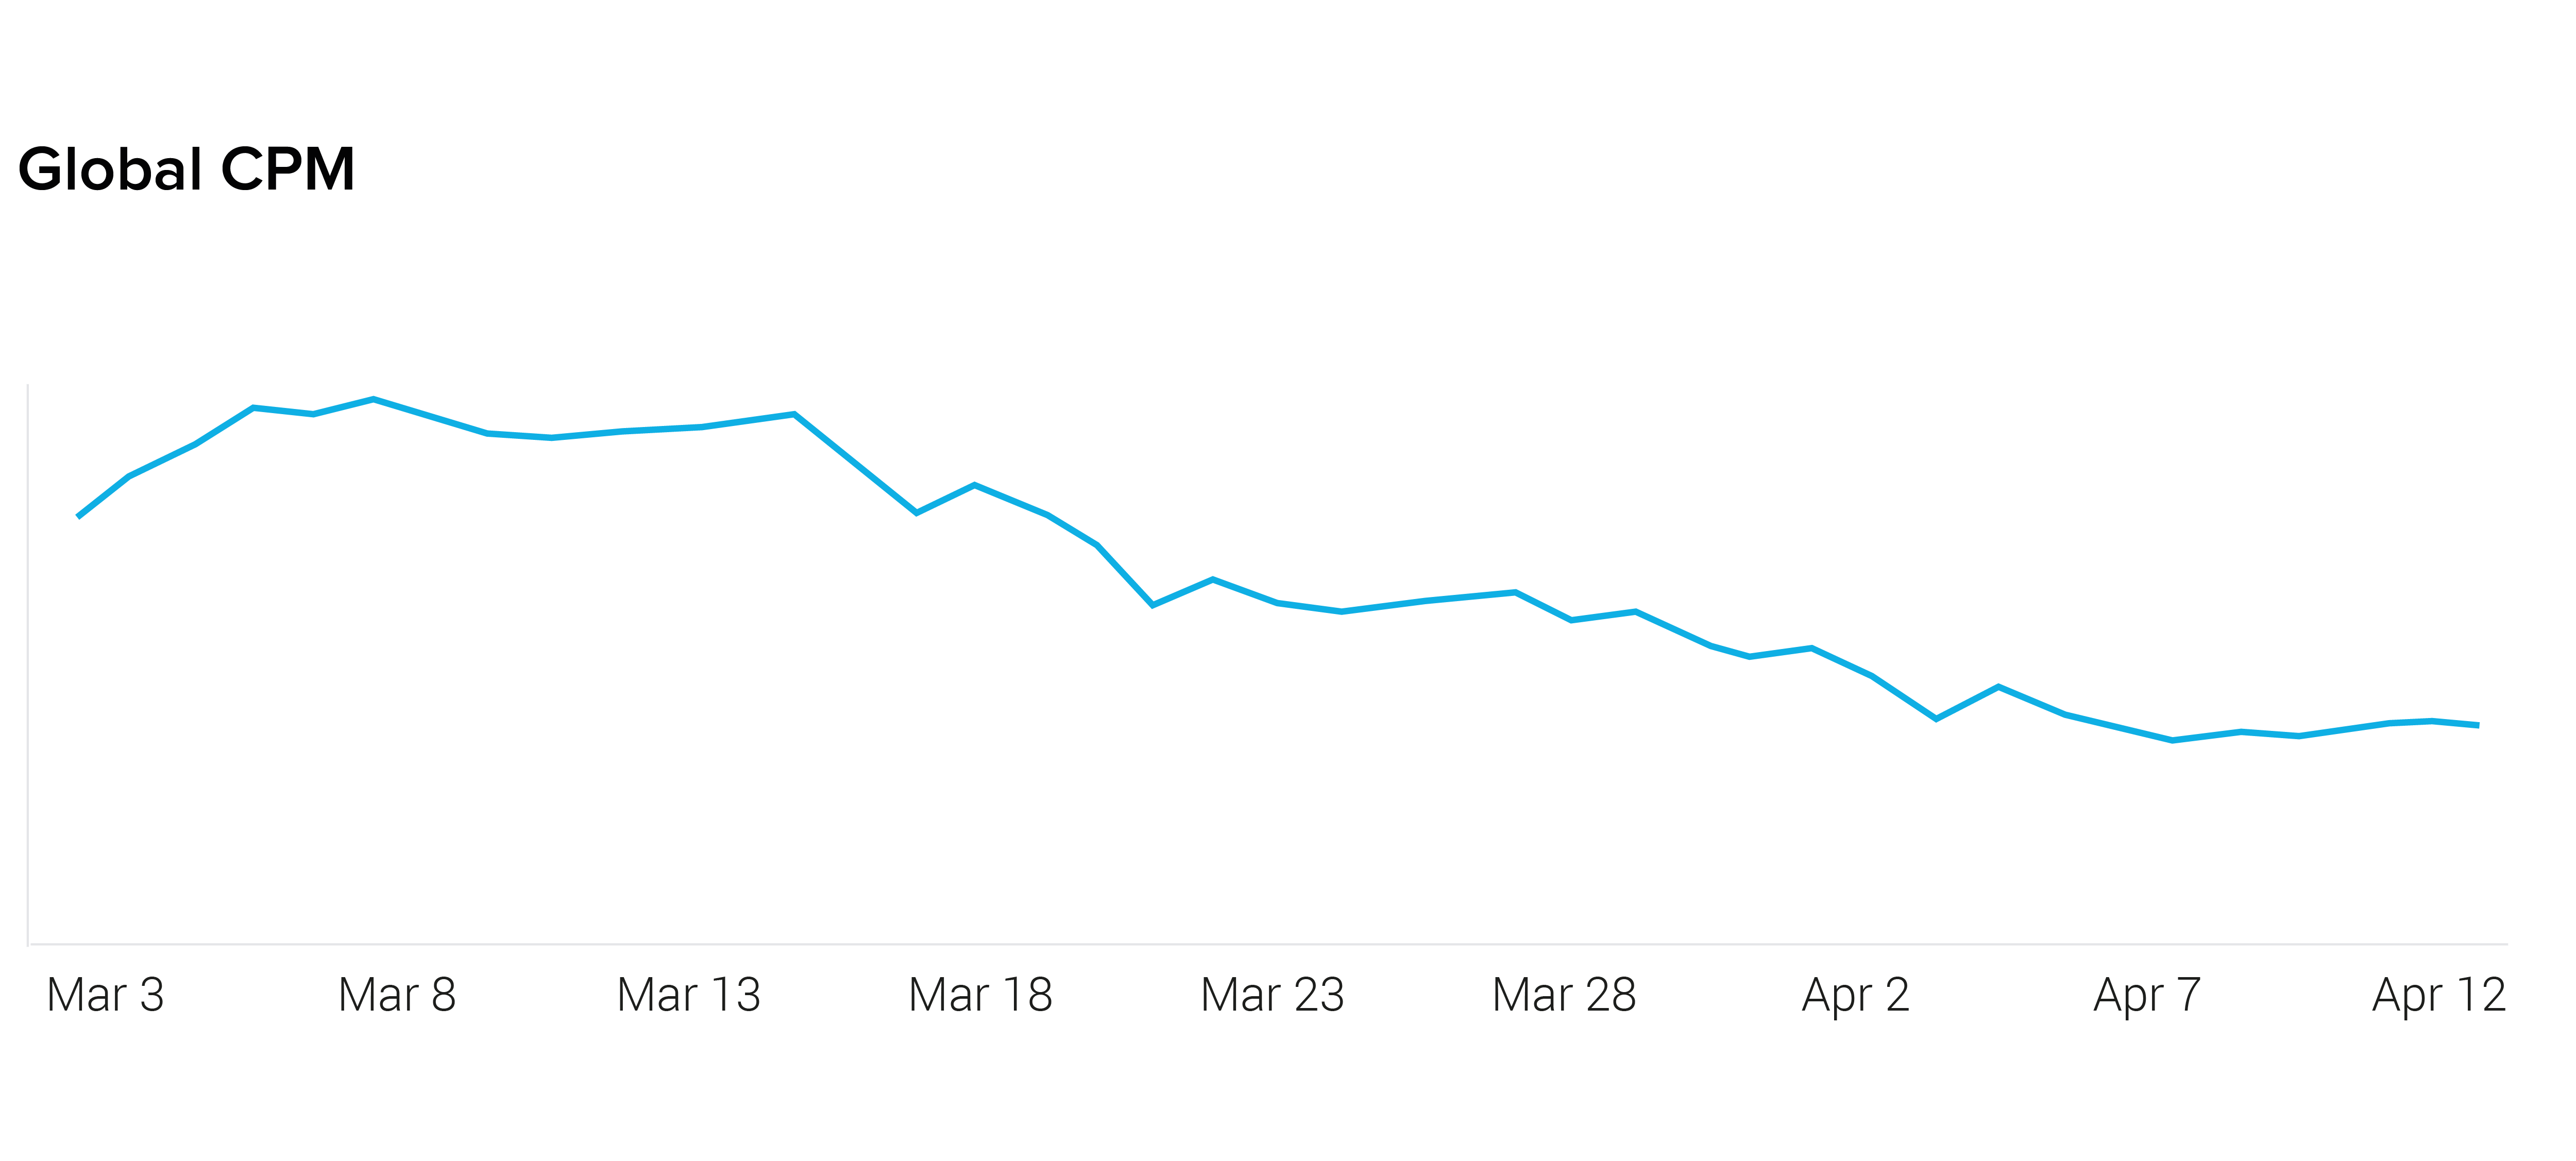
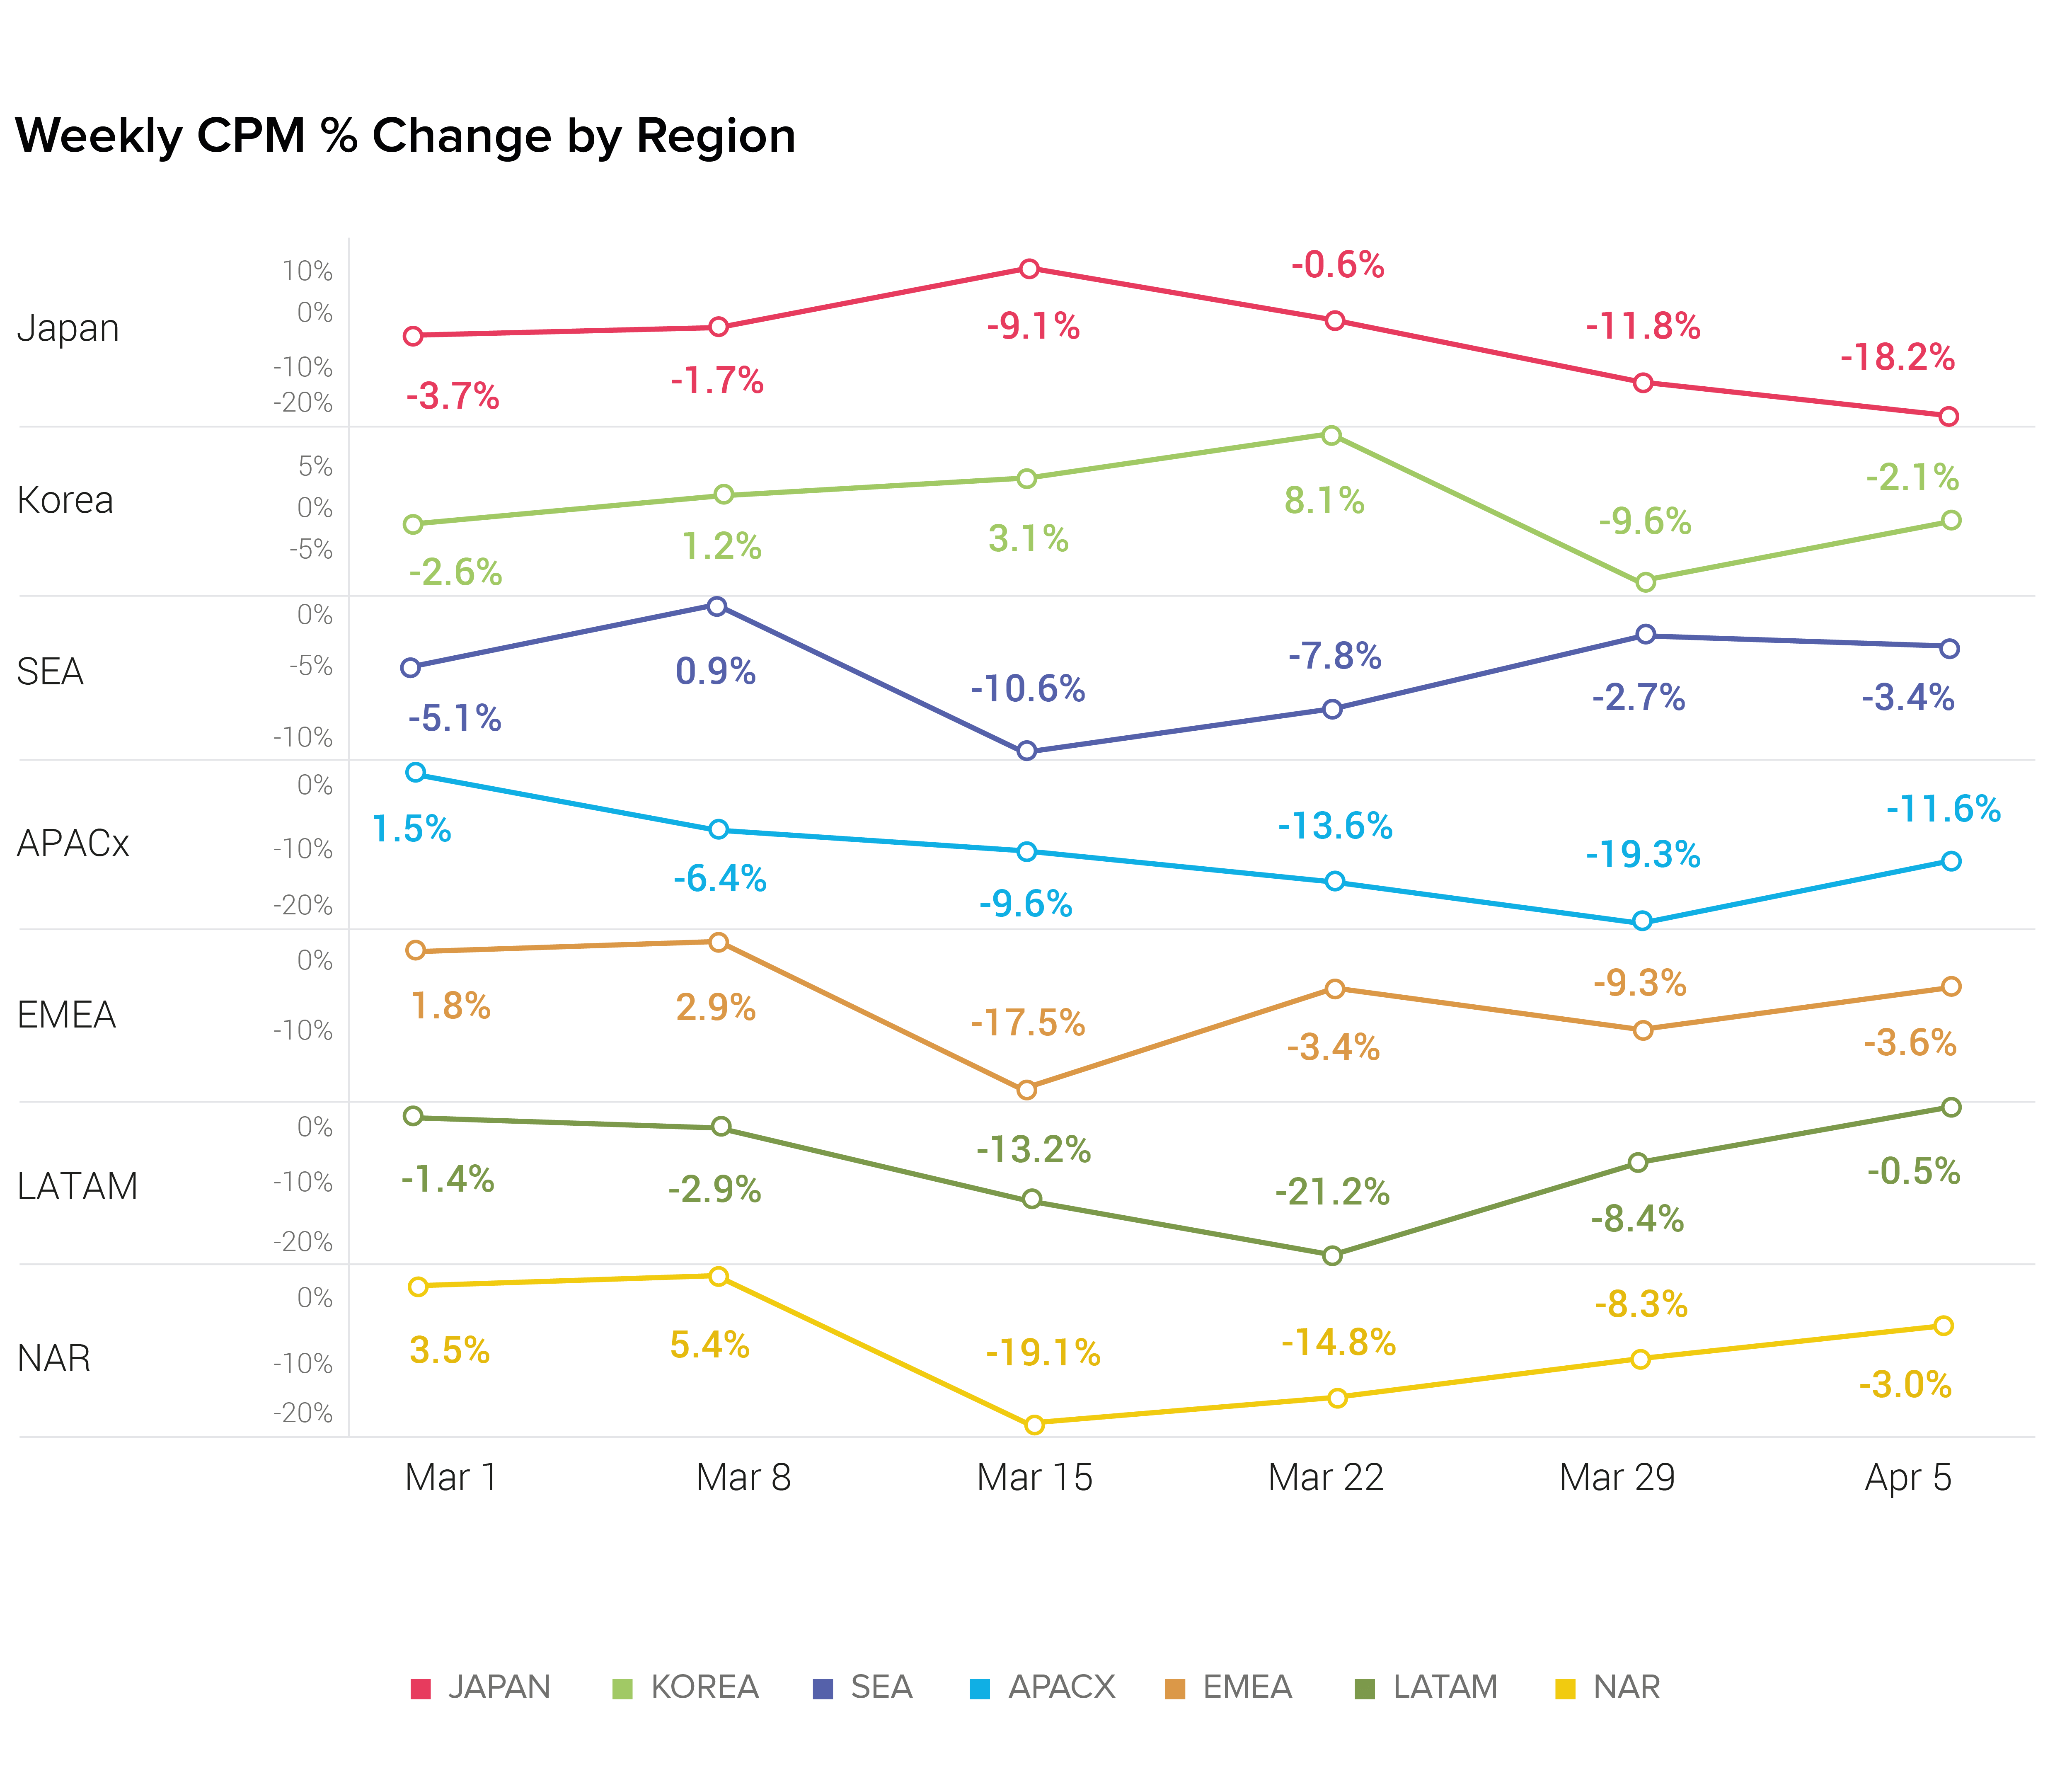
- Global CPMs increased for the first time since early March of 2020 (2.1%). However, the overall change was relatively small. Japan, Korea, & SEA saw decreases in CPMs while other regions increased.
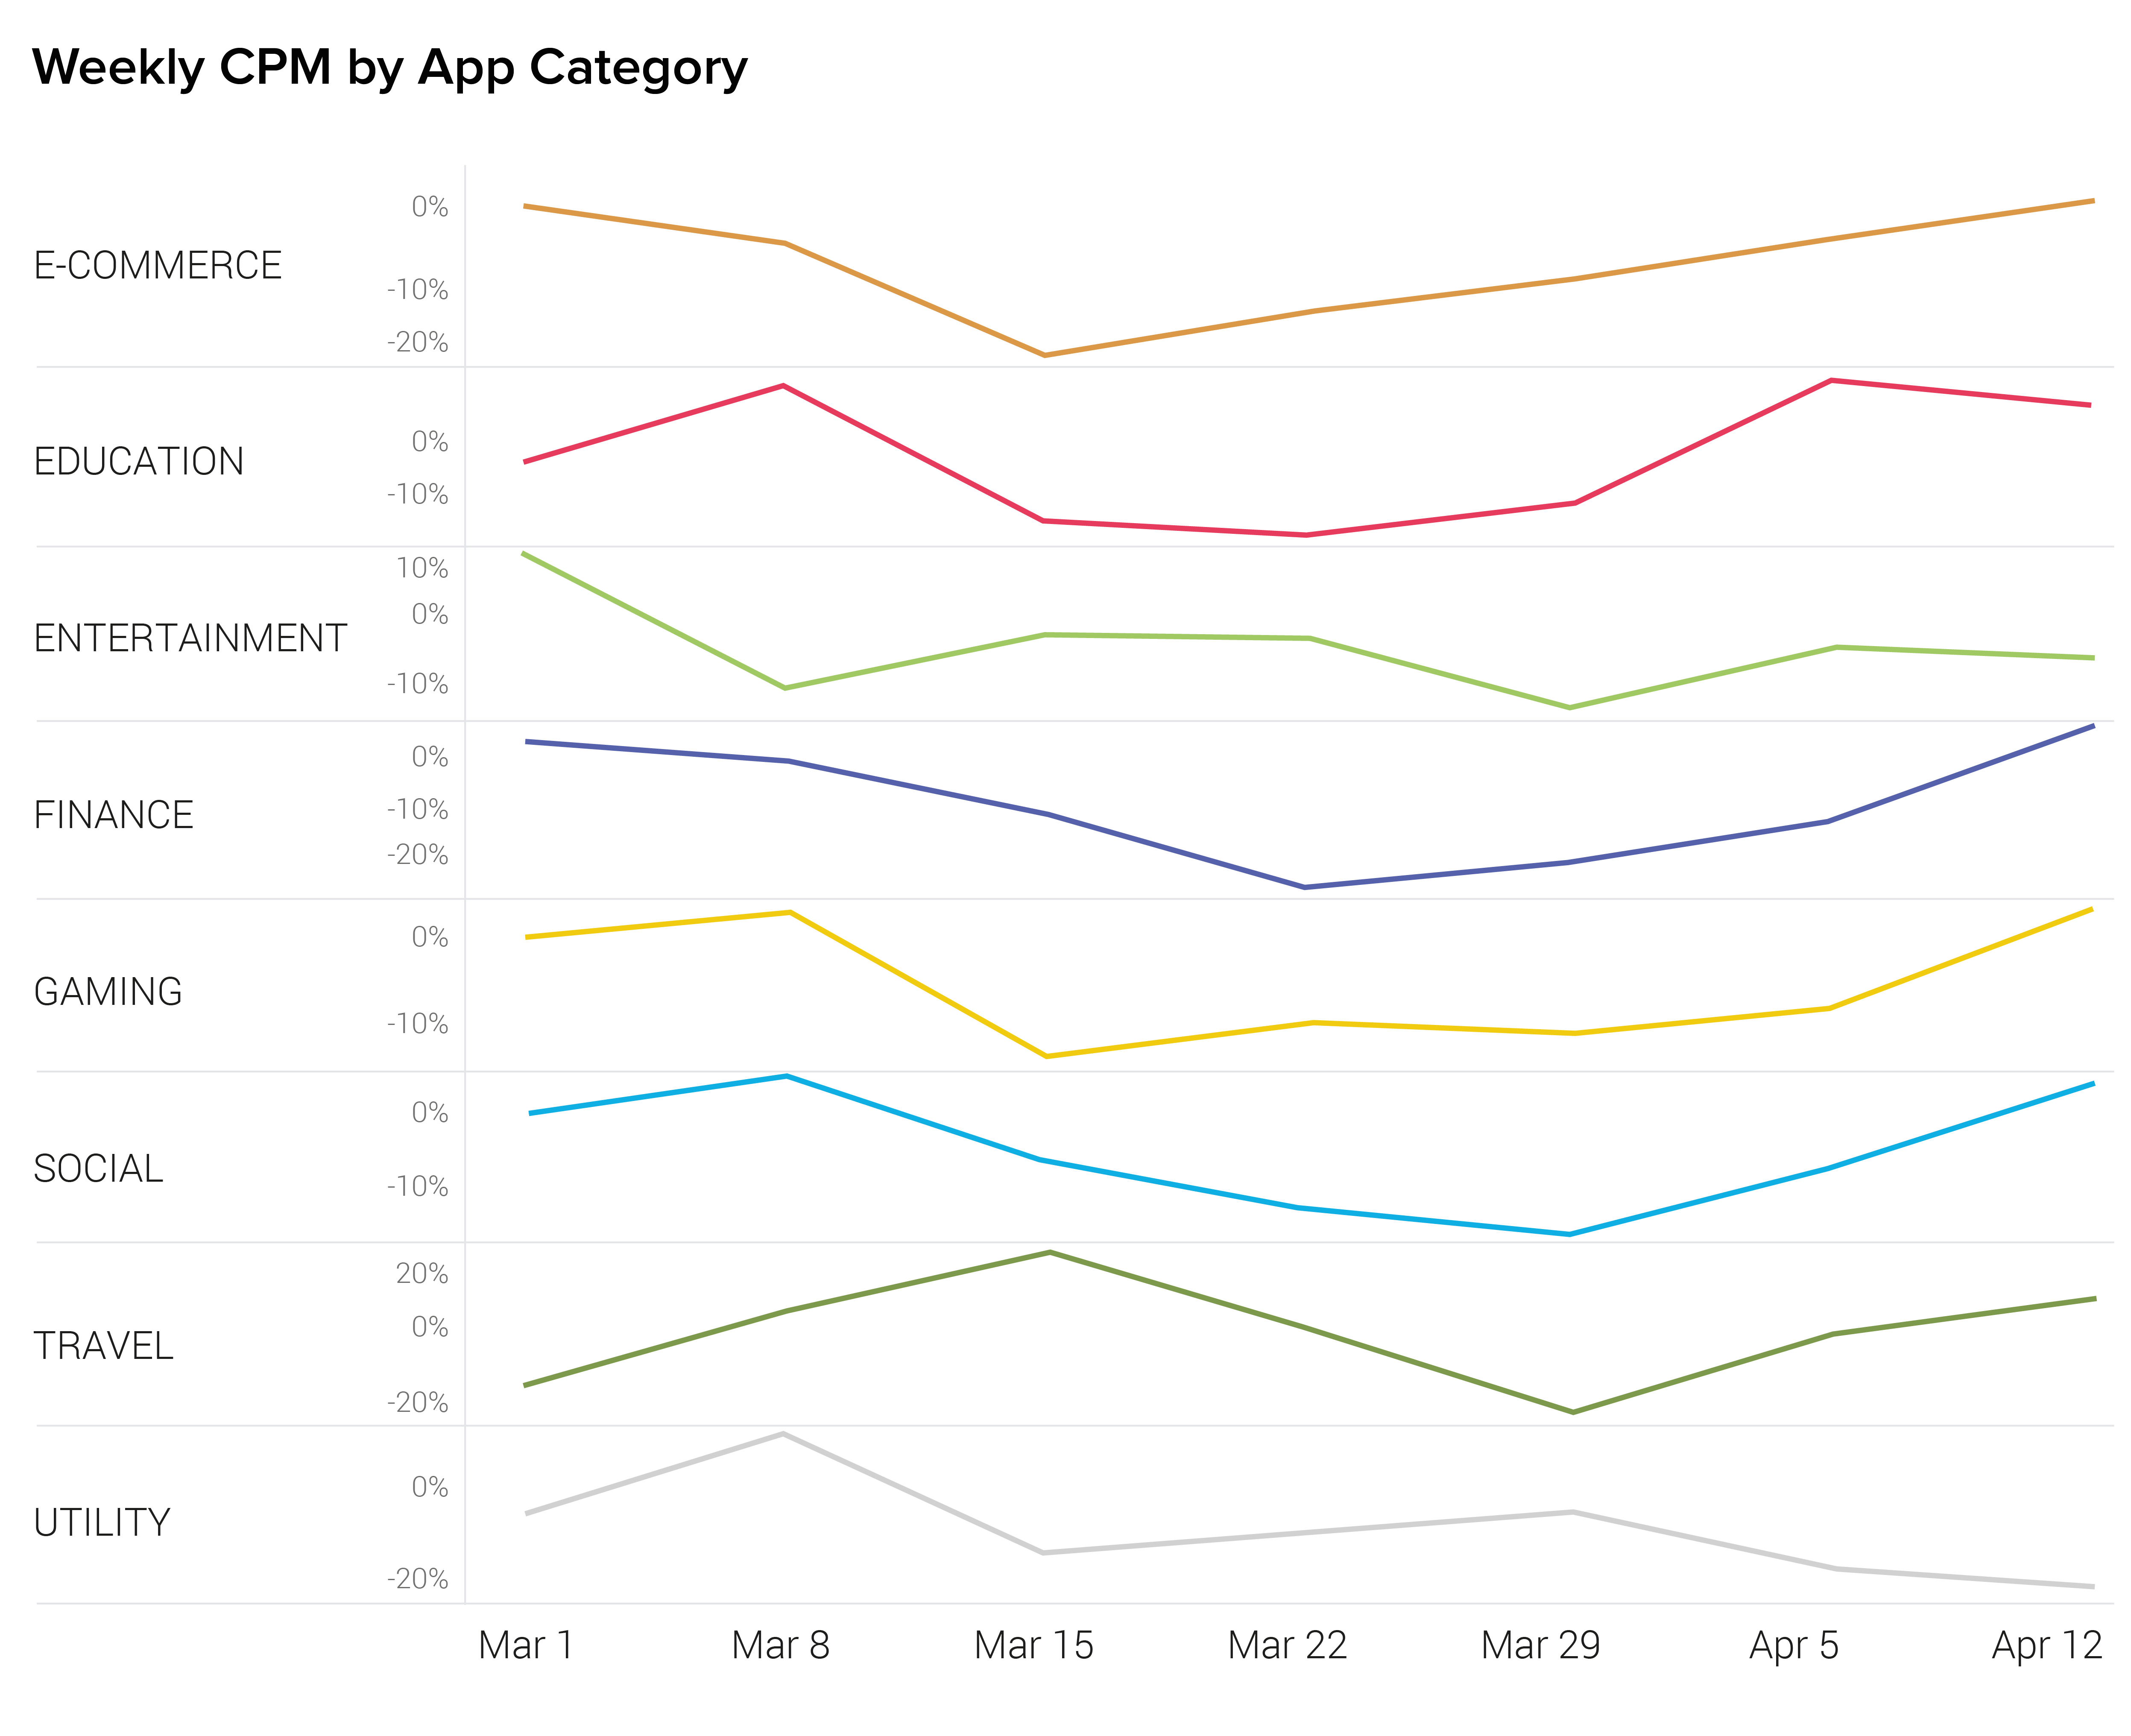
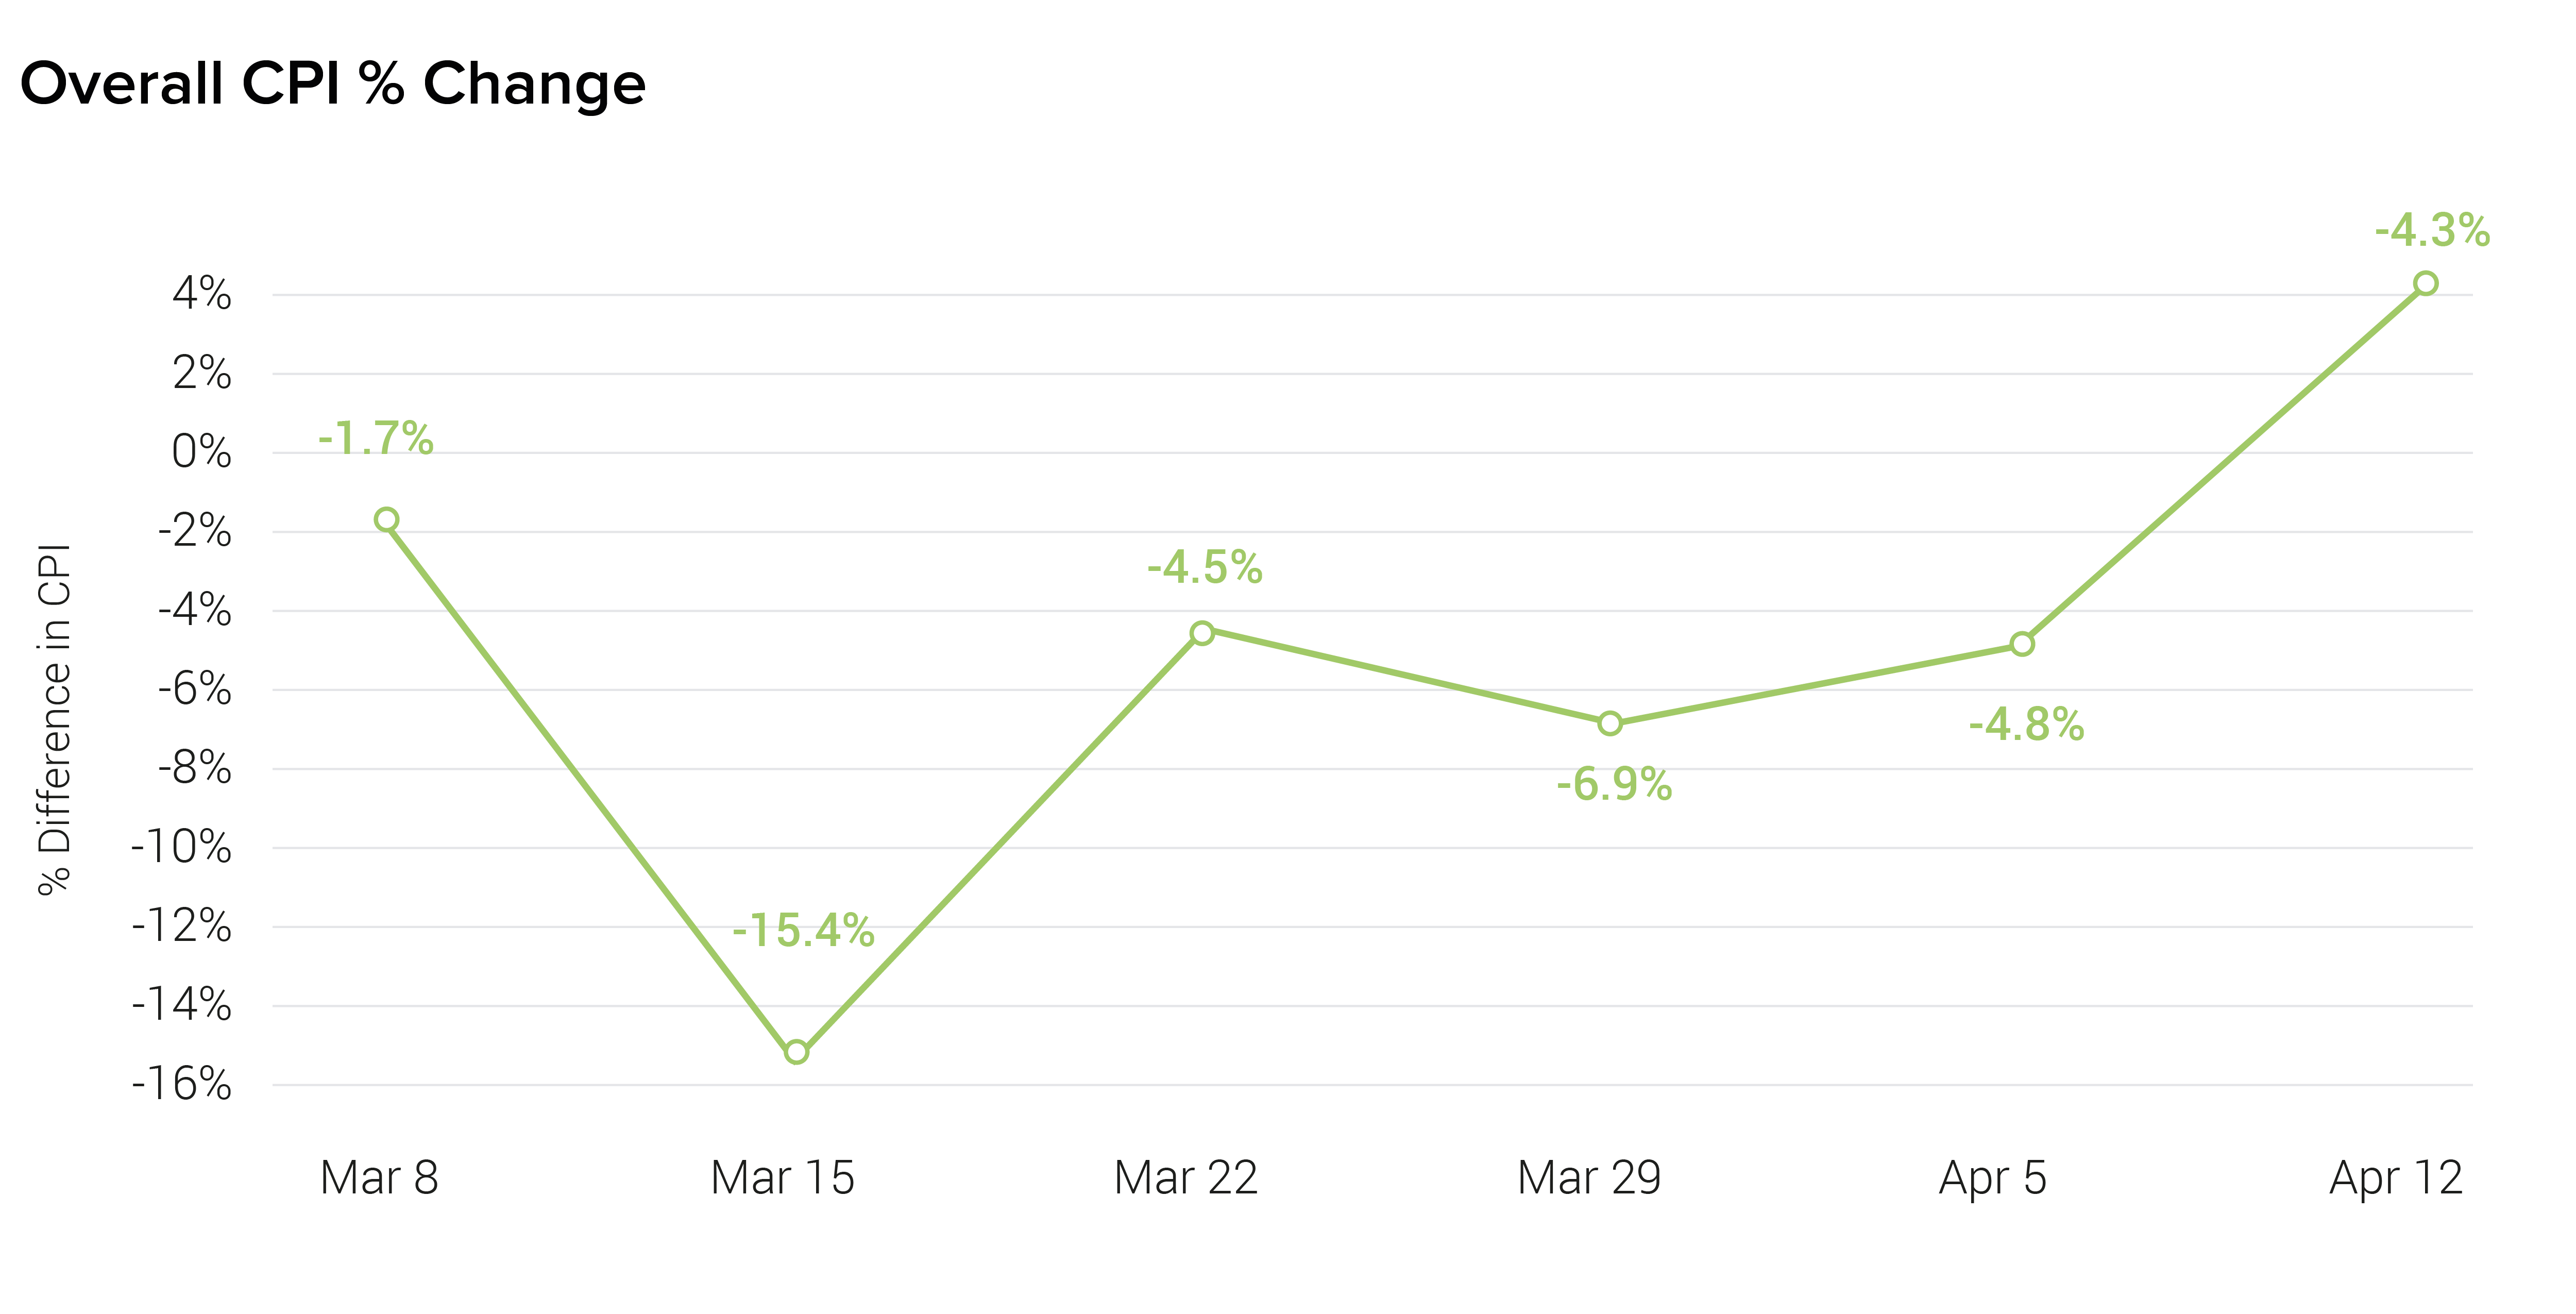
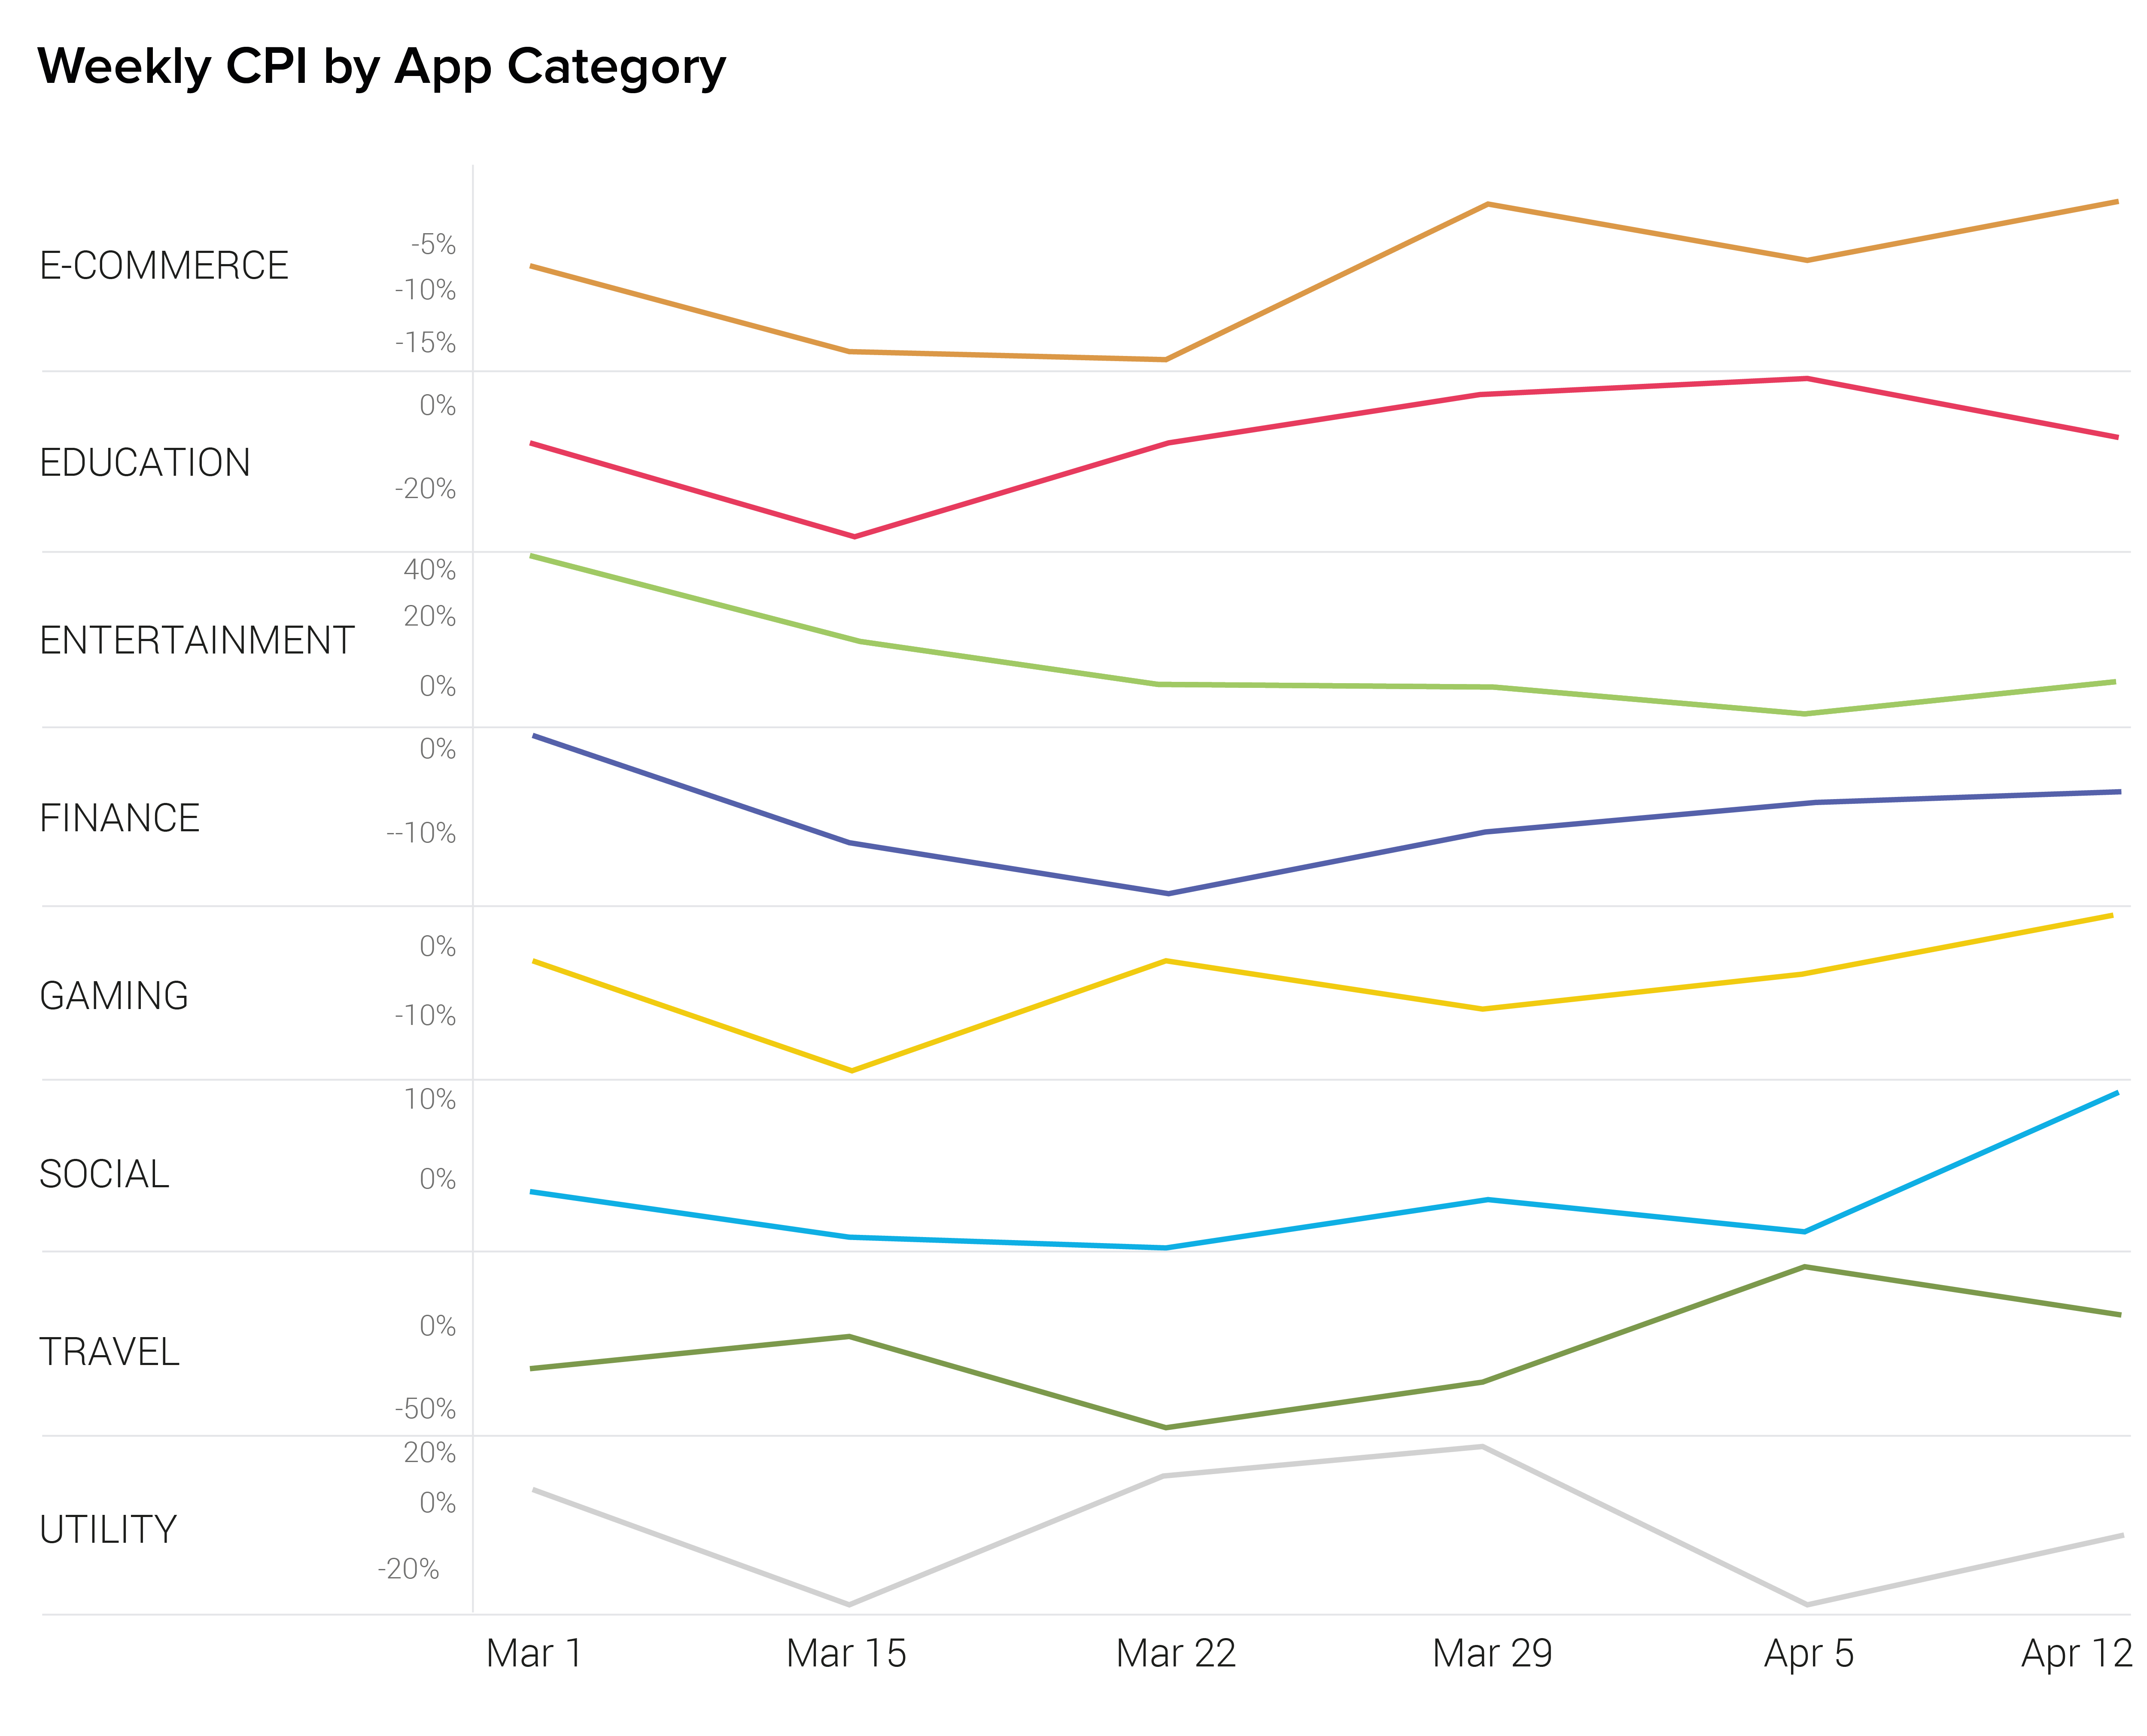
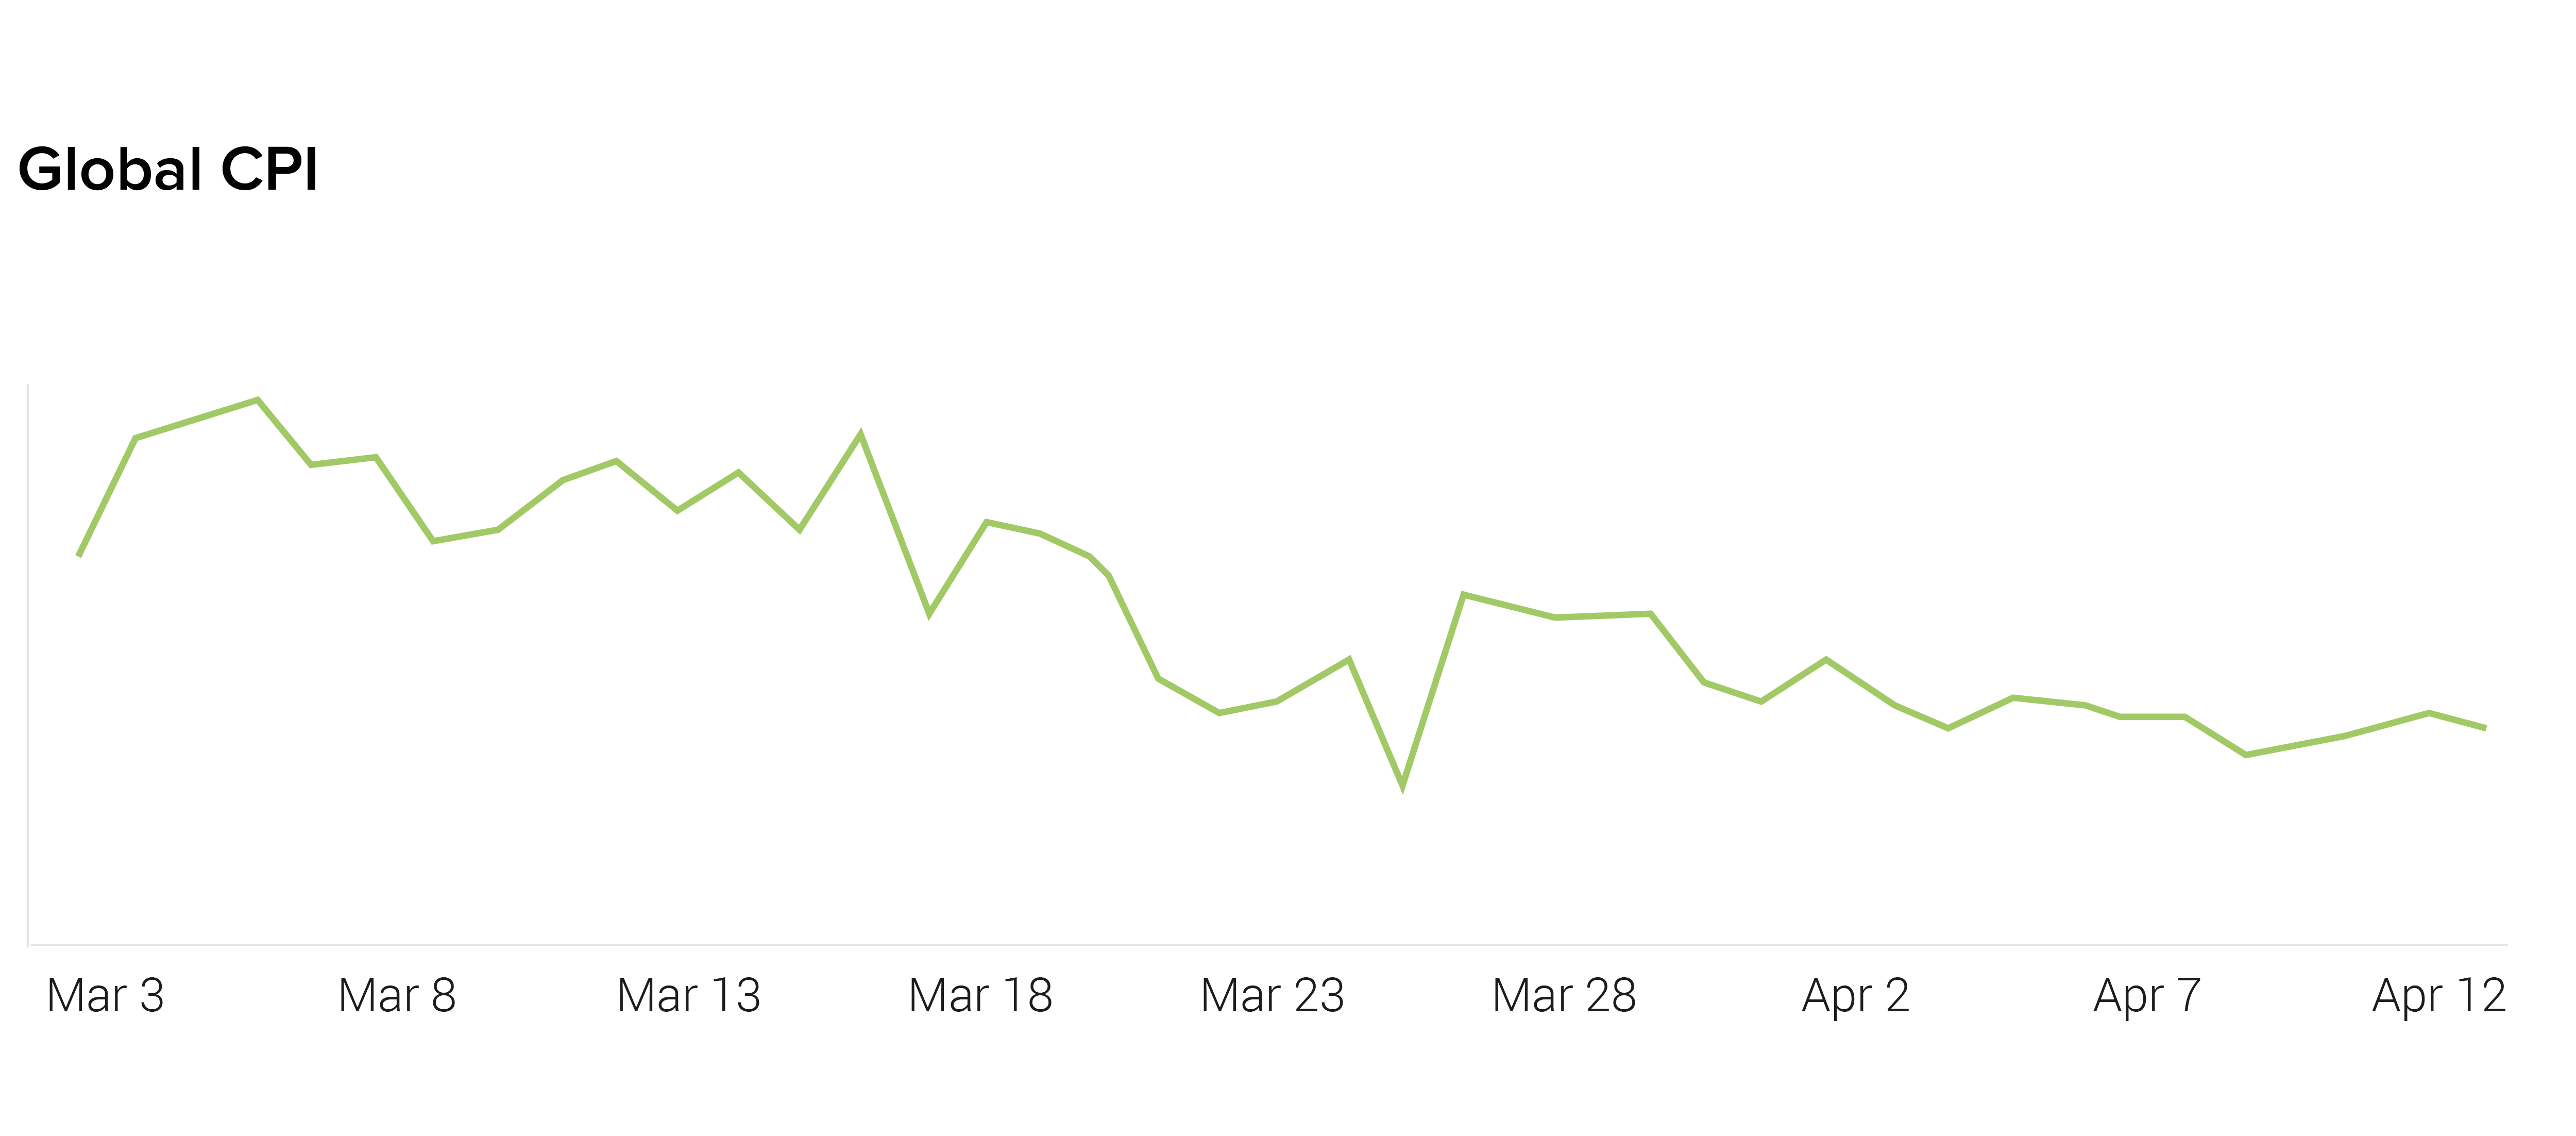
- Global CPIs increased for the first time in 6 weeks (4.3%). When looking at all regions, this week’s changes in CPIs tend to mirror the increase in CPMs. This suggests that performance was relatively similar WoW. CPIs in Social/Dating apps saw the biggest increase (11.5%).
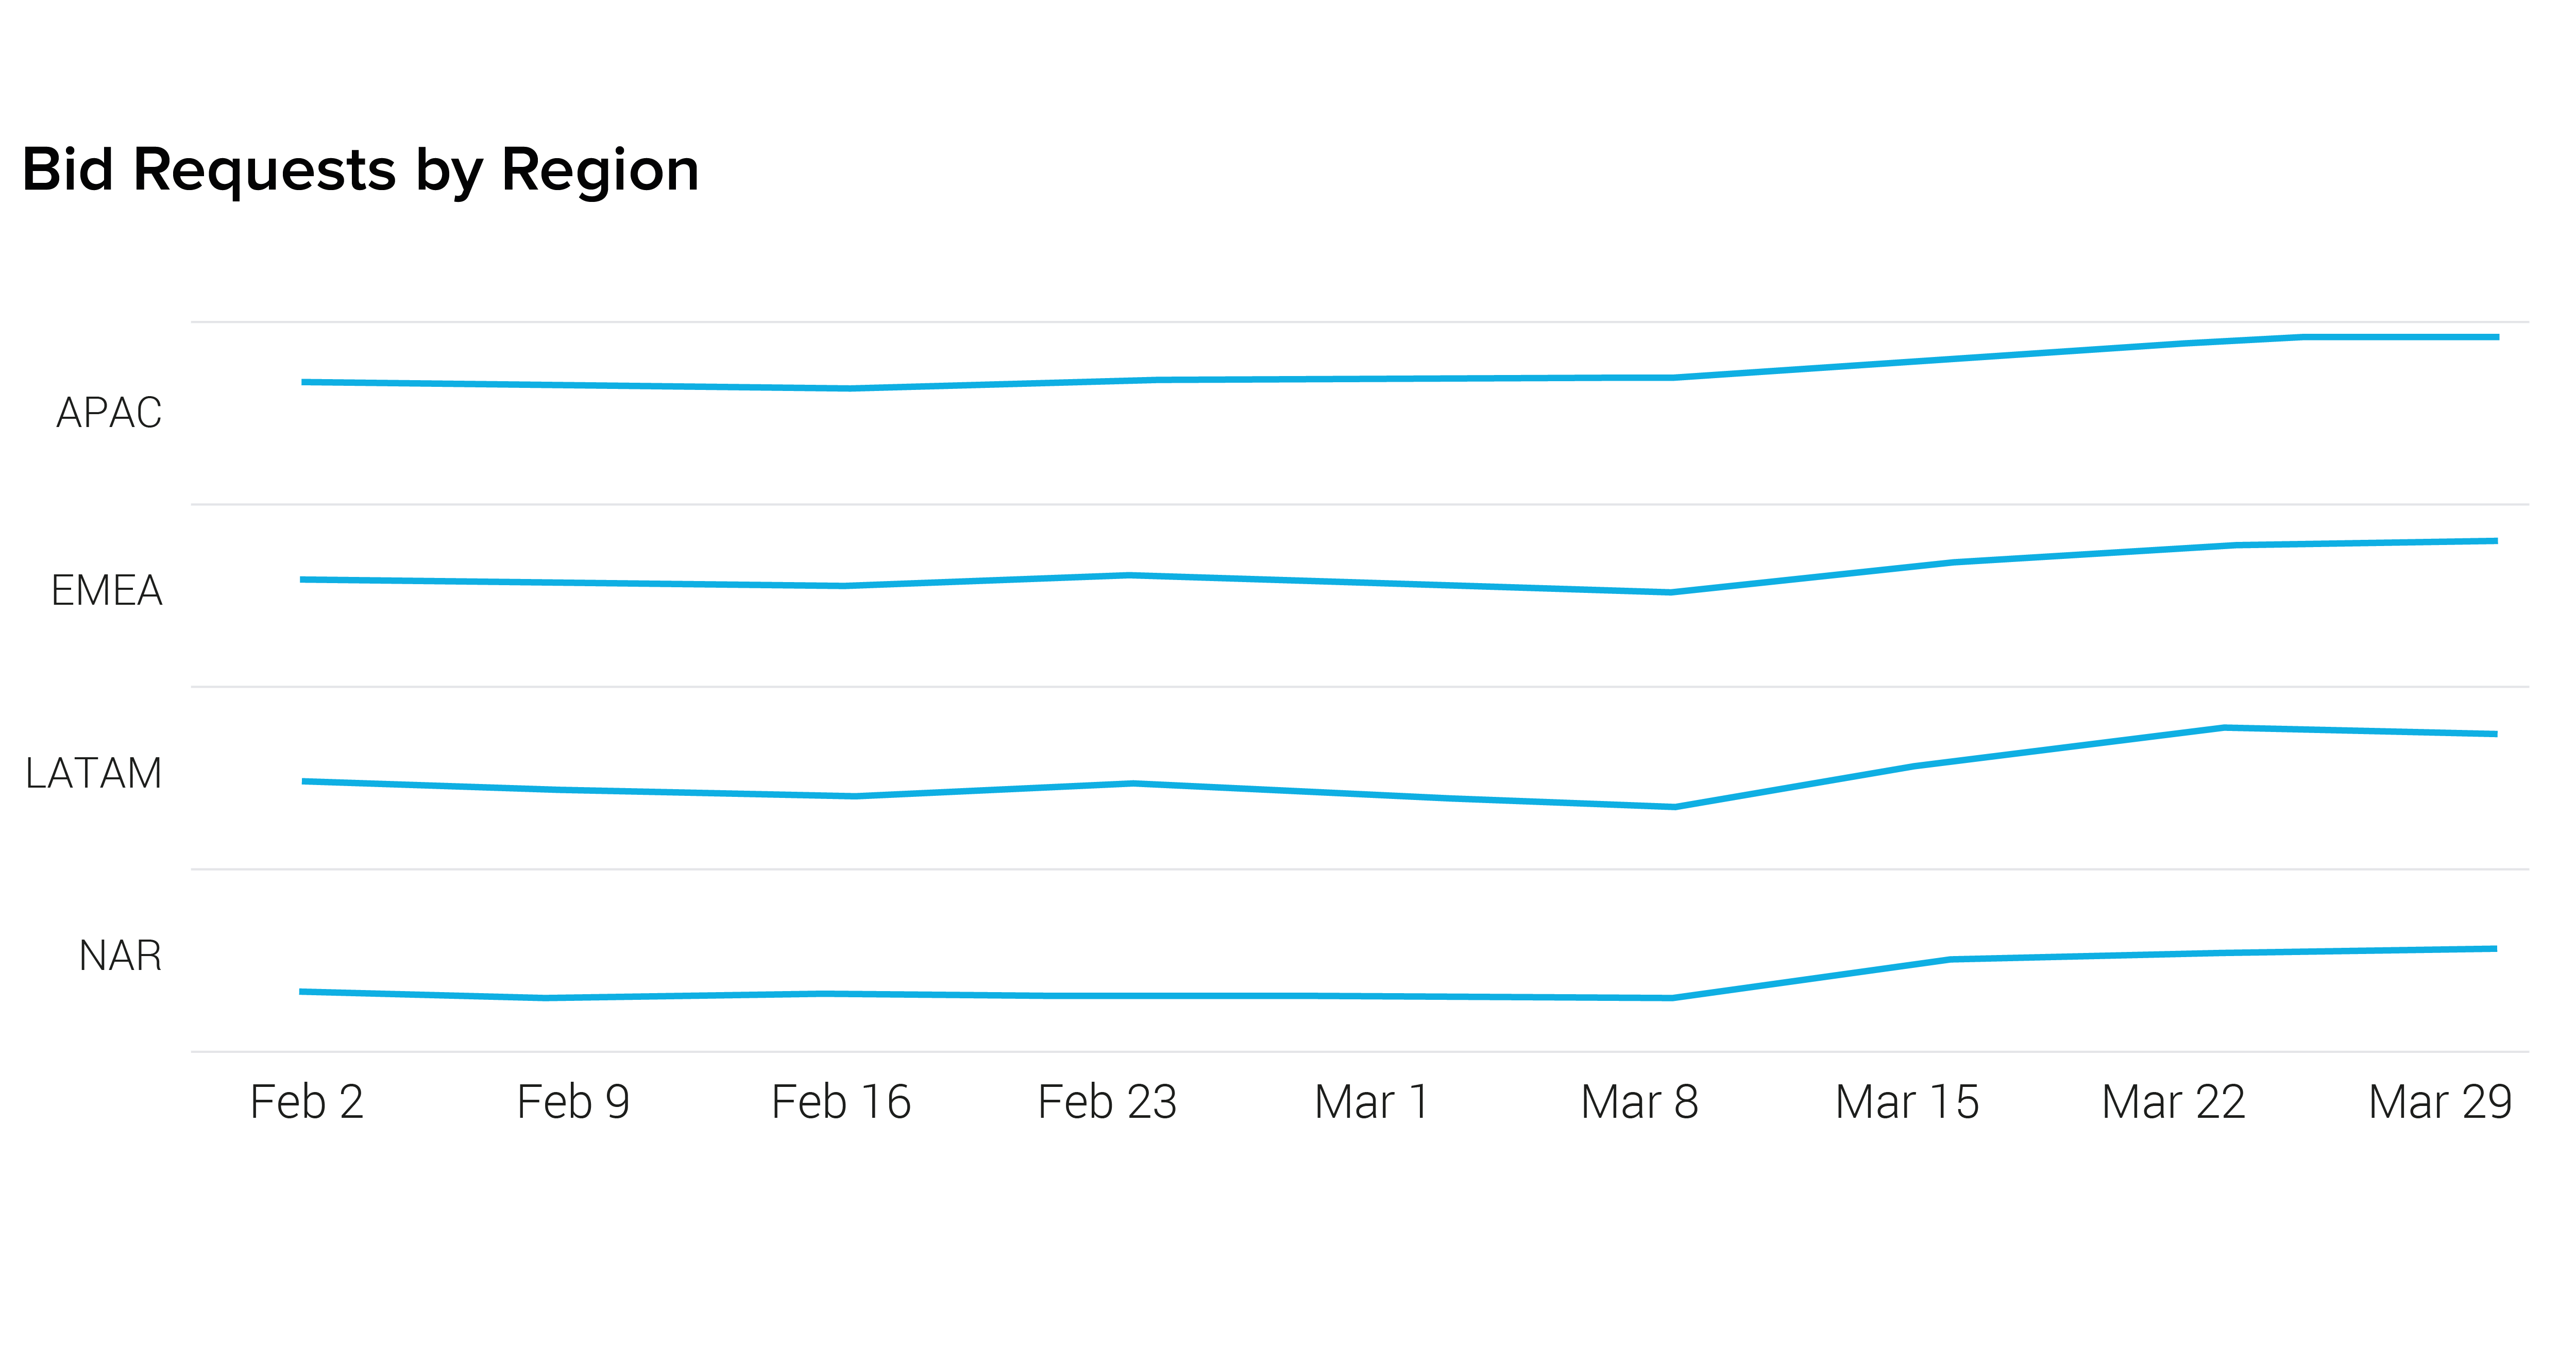
Bid Requests
CPM
CPI
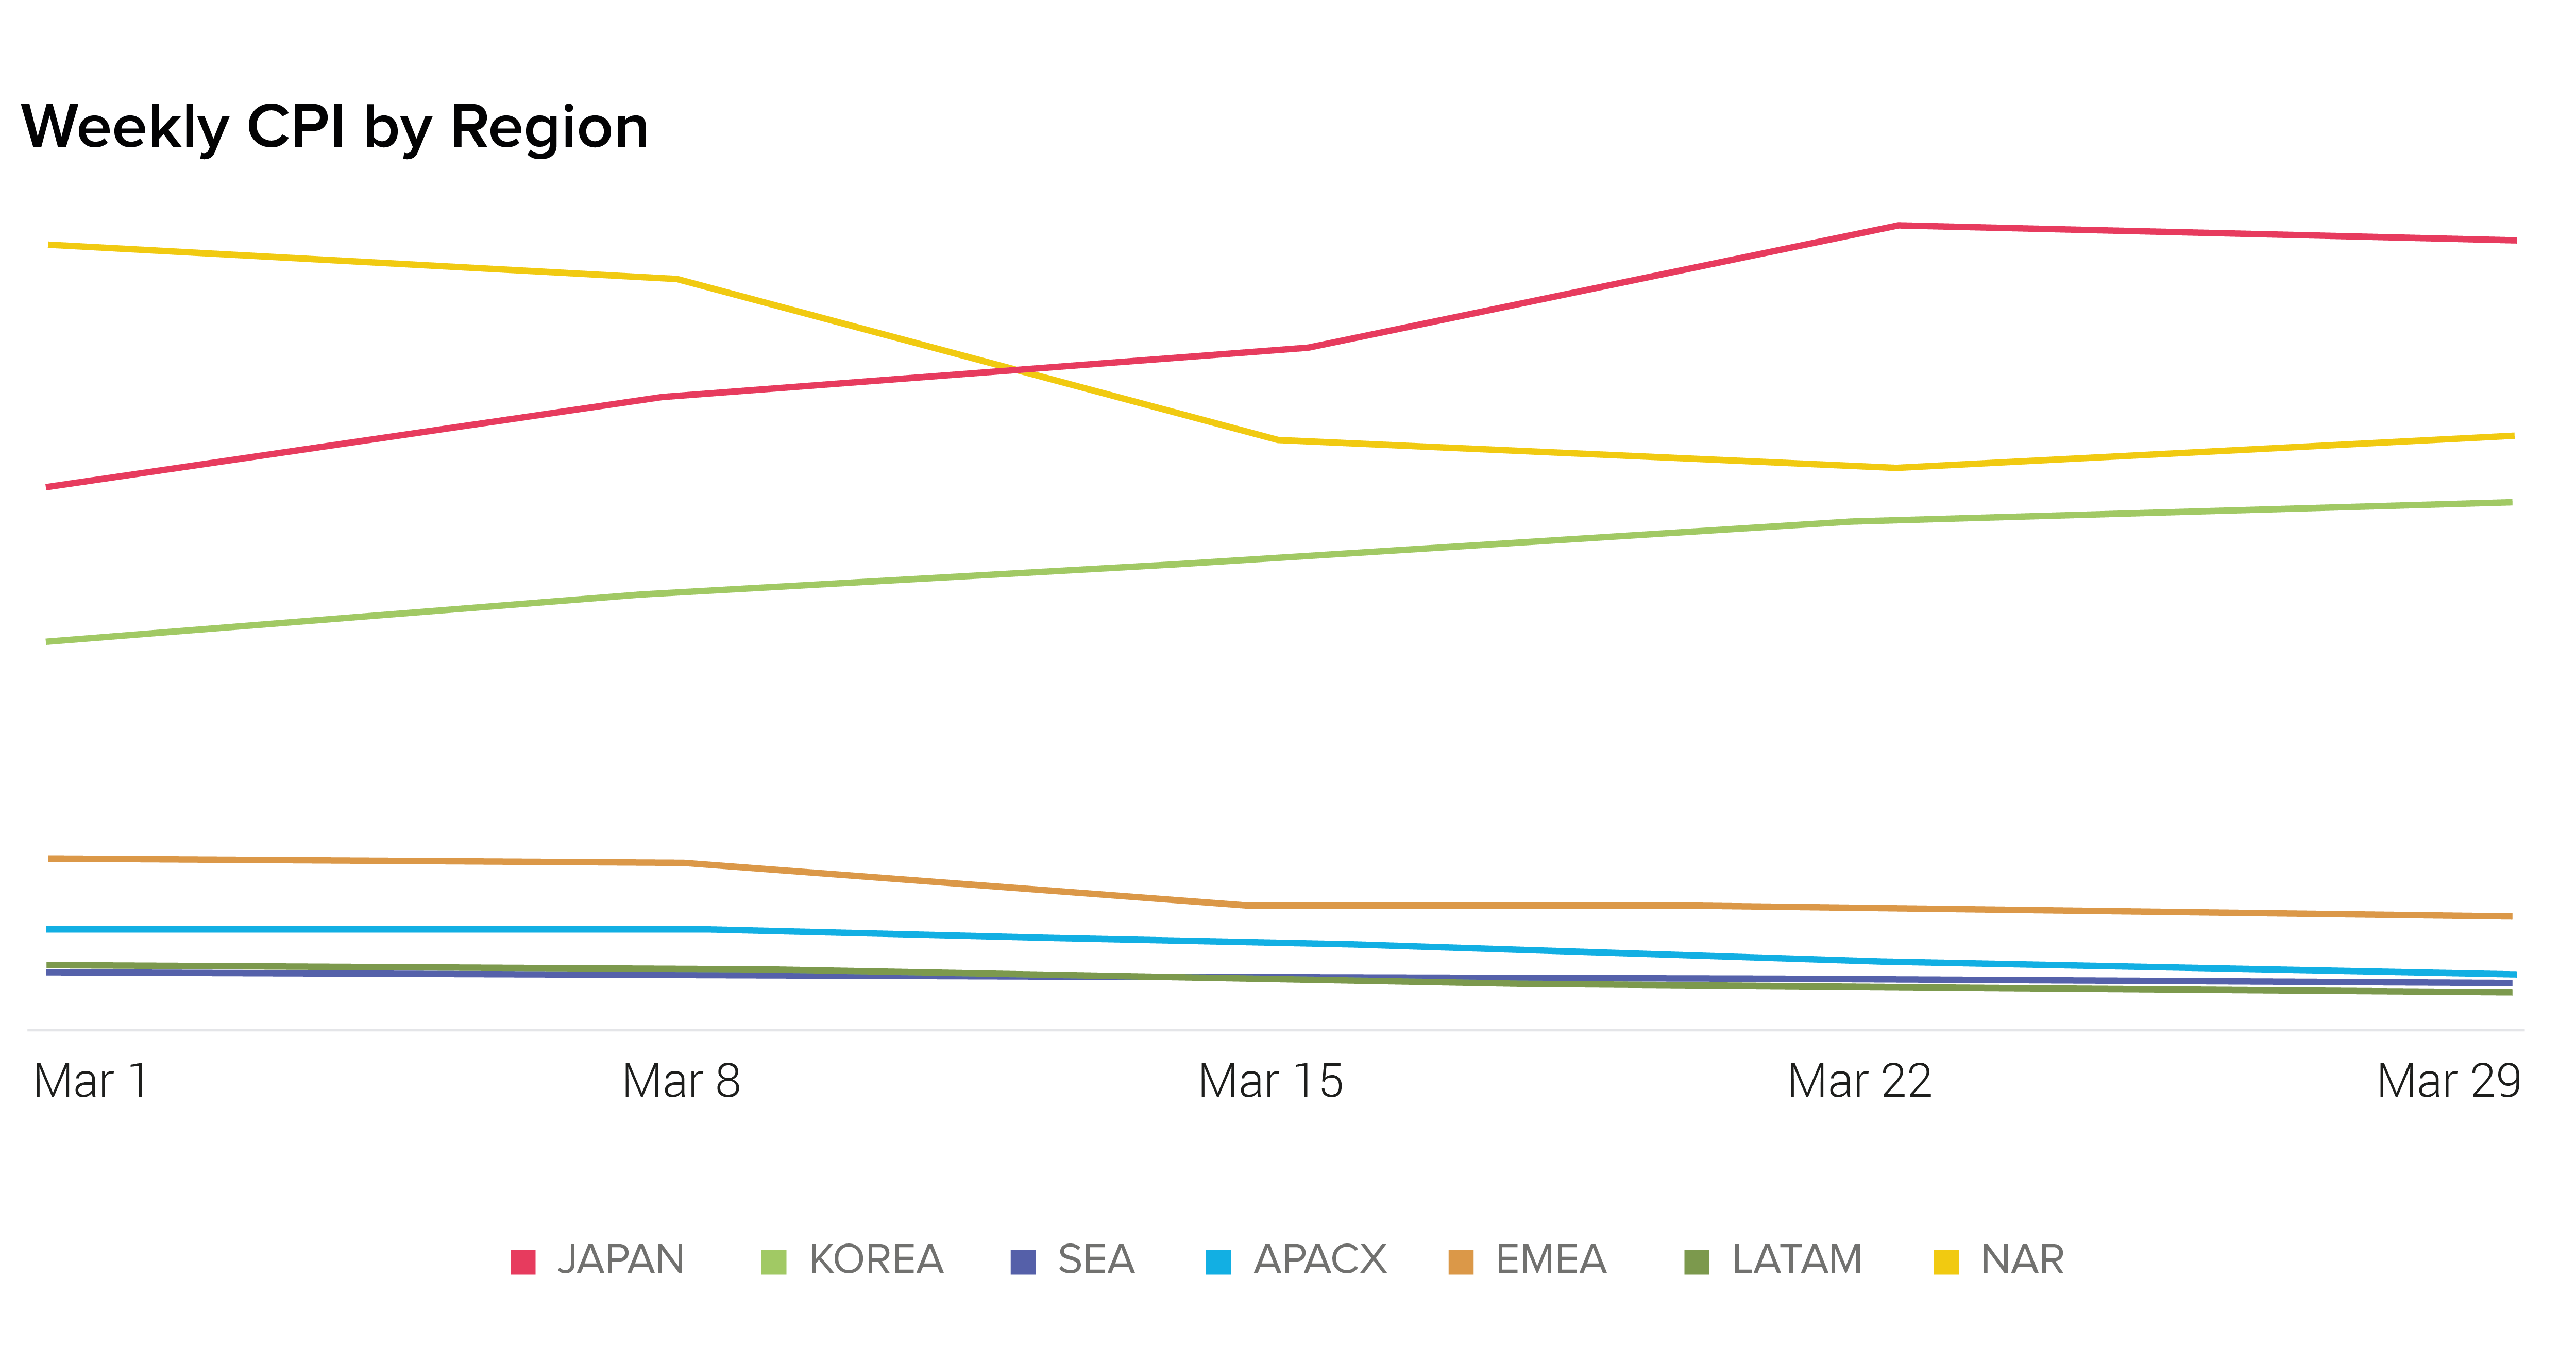
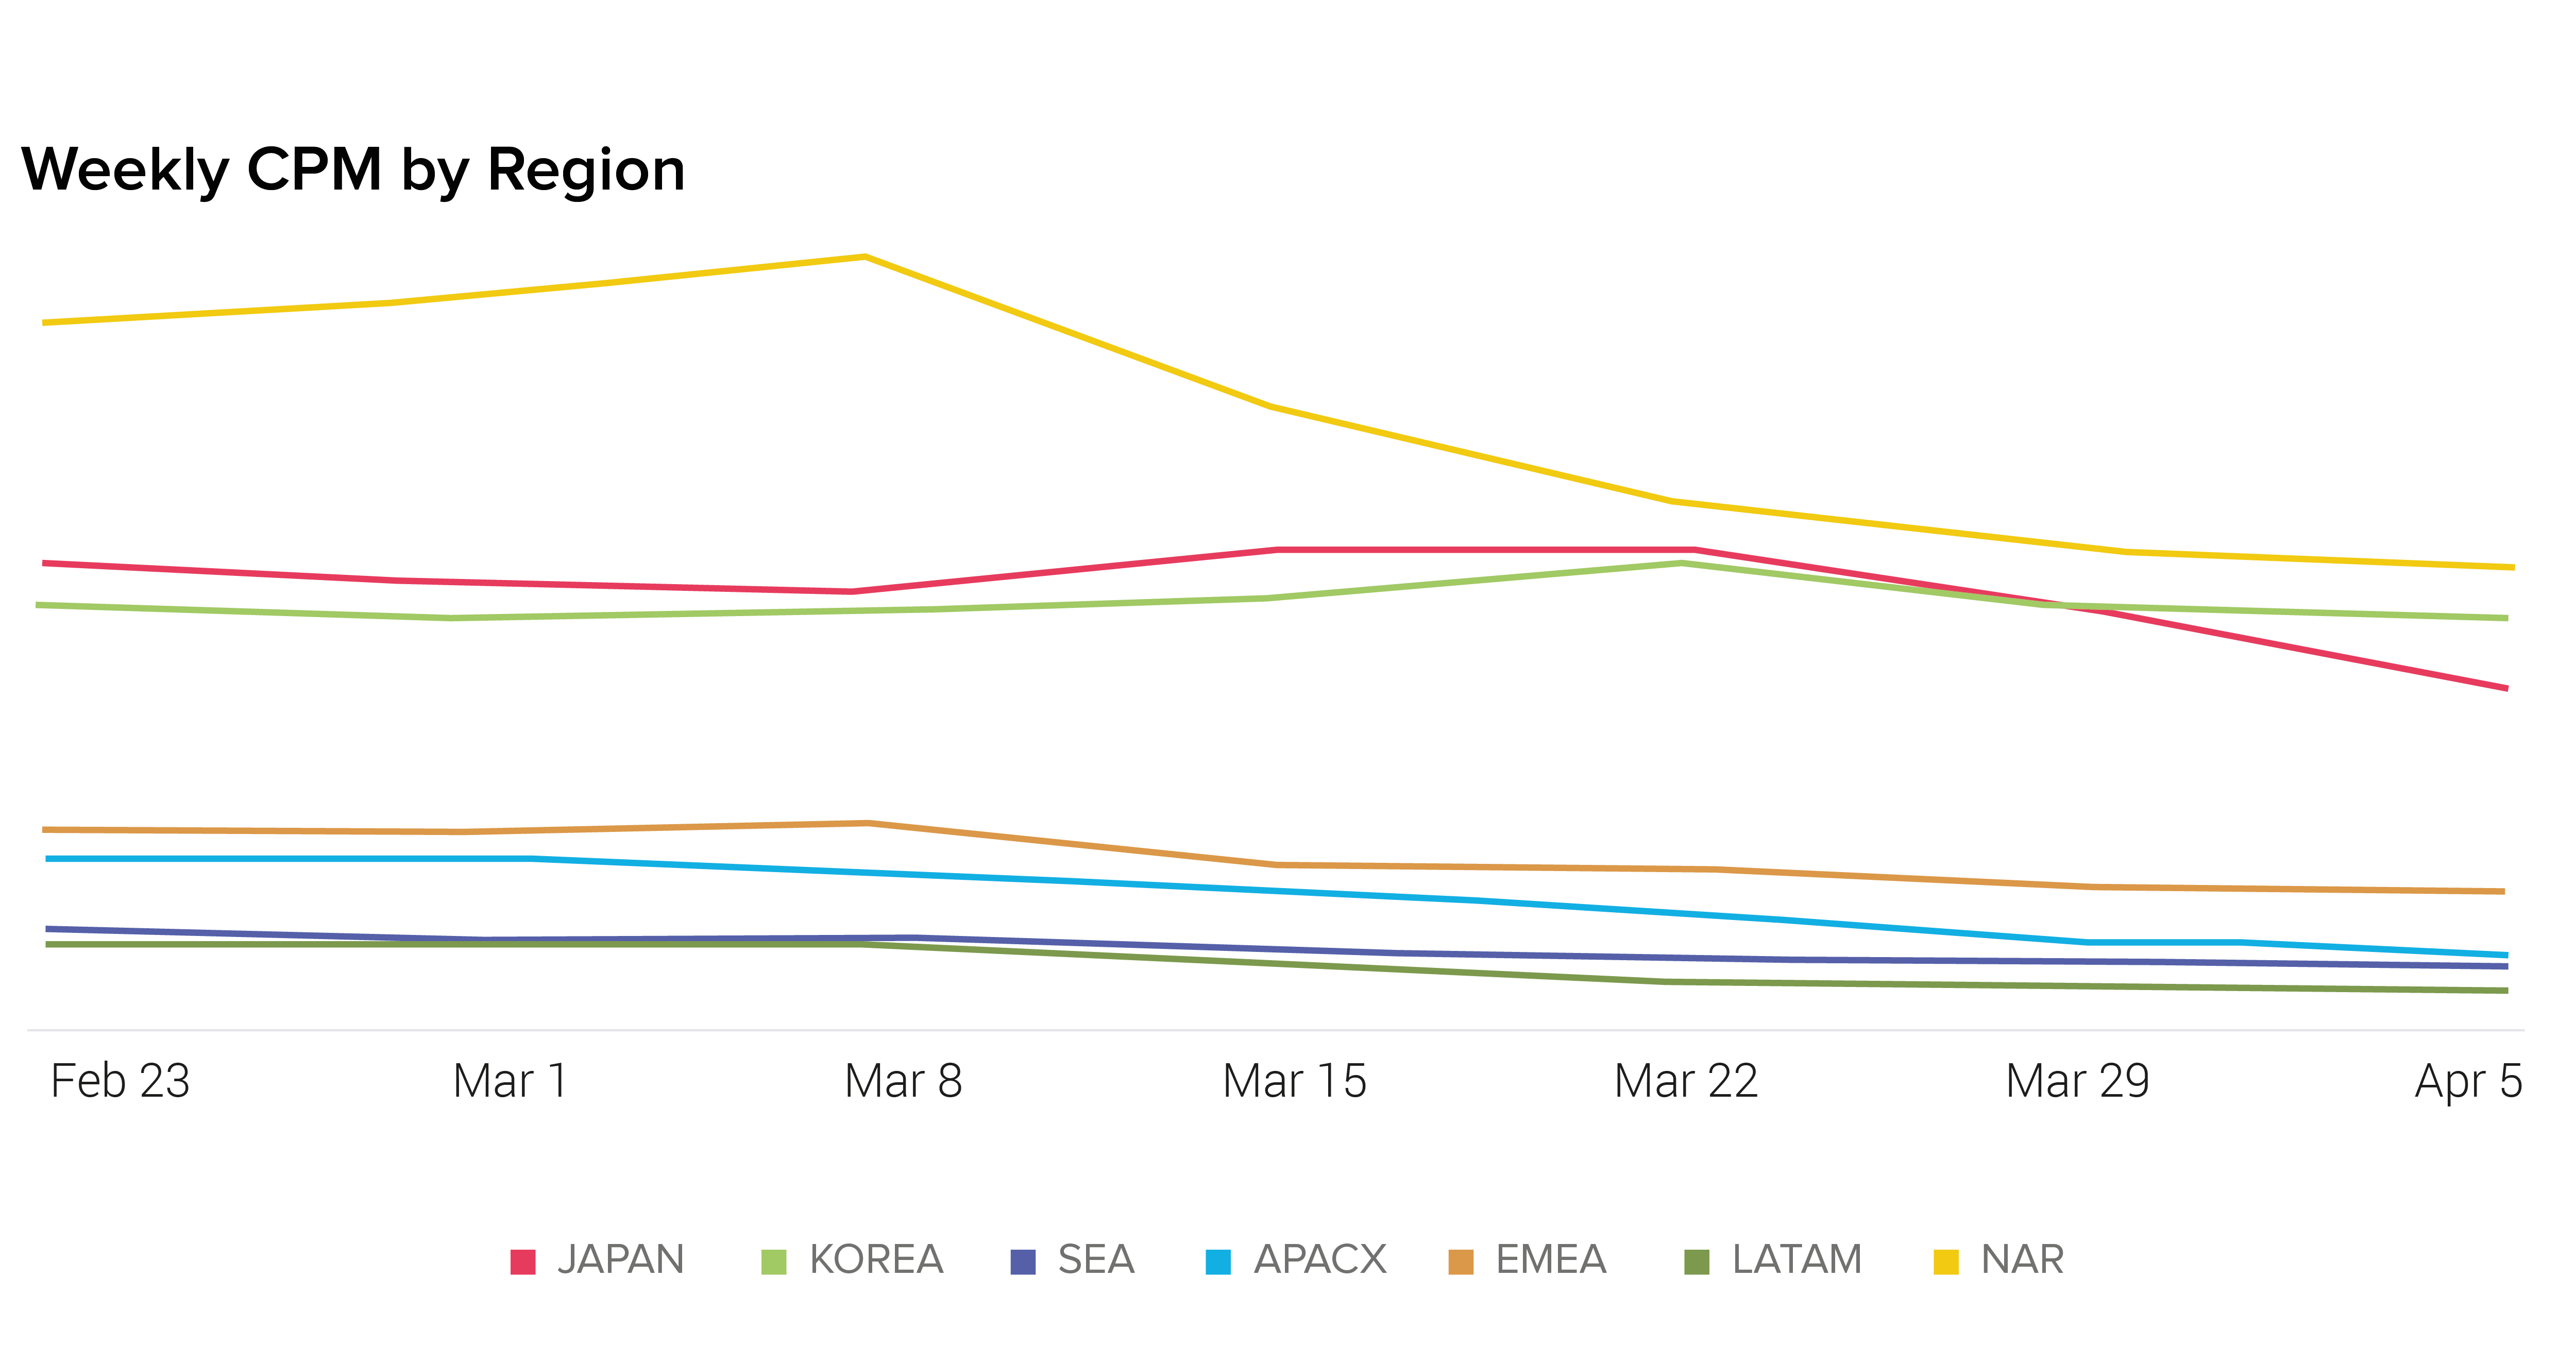
Note: APACX includes APAC as a region and excludes Japan, Korea and Southeast Asia.
April 14, 2020
MAPT tracks weekly changes across several key mobile ad performance KPIs. Make sure to bookmark this page and check back weekly for the most up-to-date information.
This week’s takeaways:
- We saw an increase in available supply, globally (+4.0%). The largest increase came from North America (+5.9%).
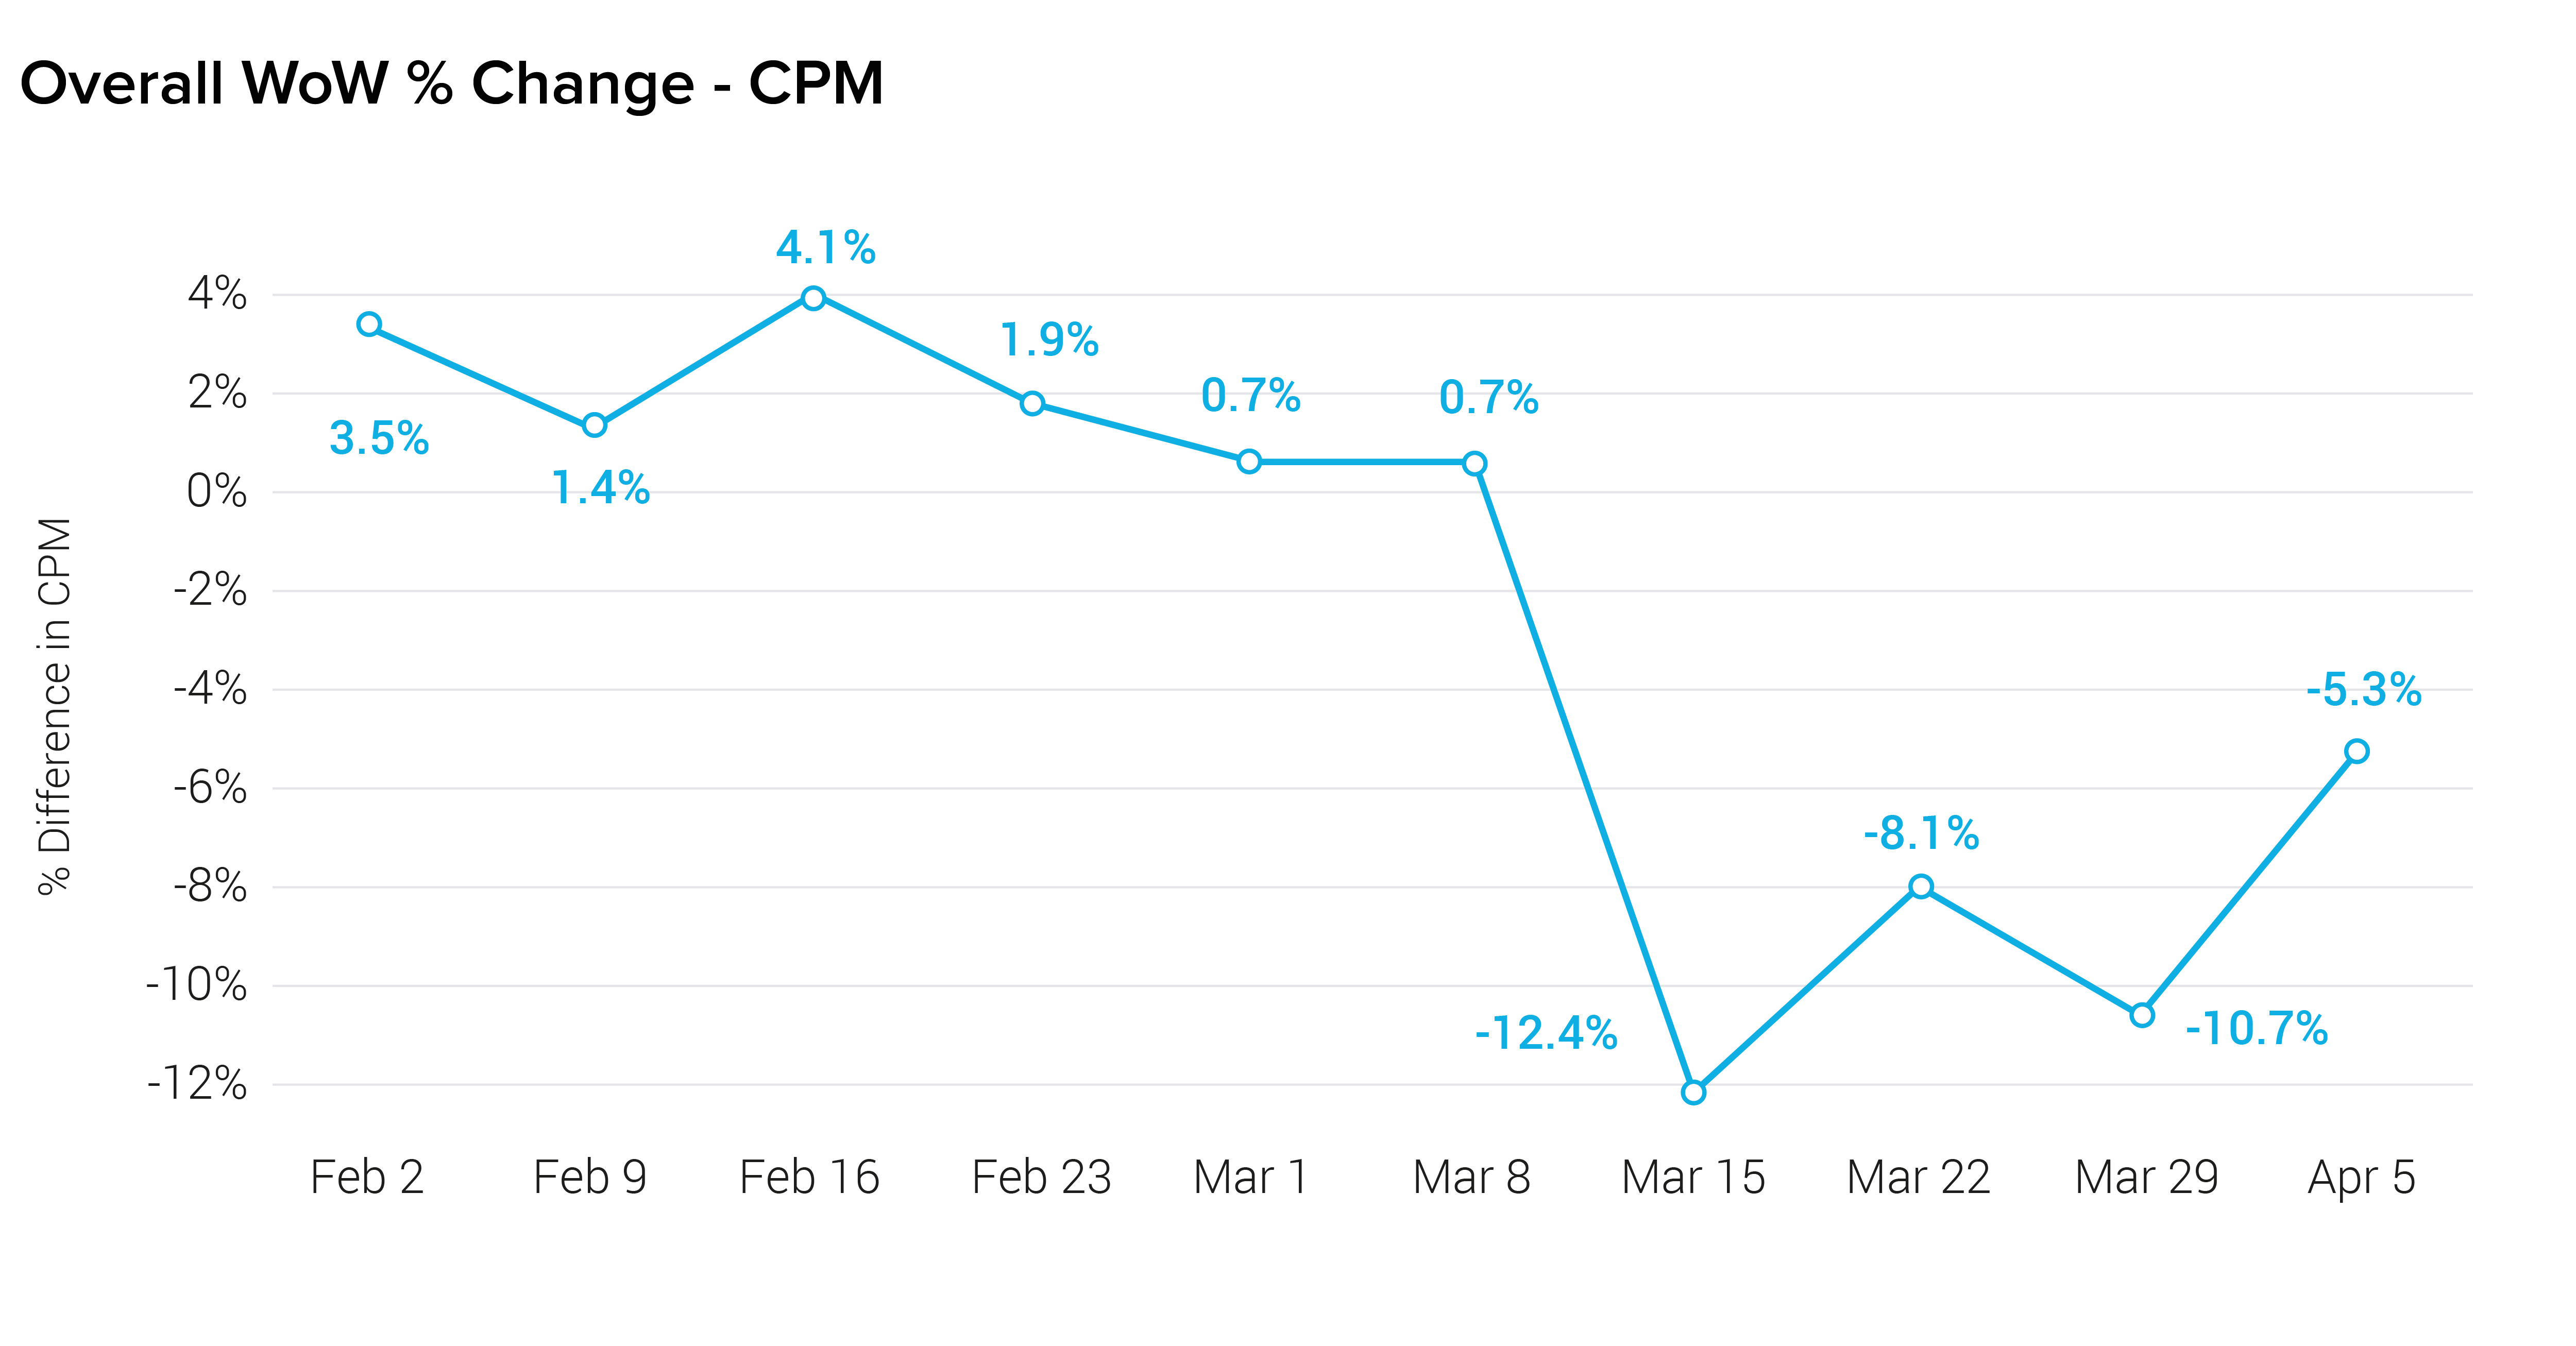
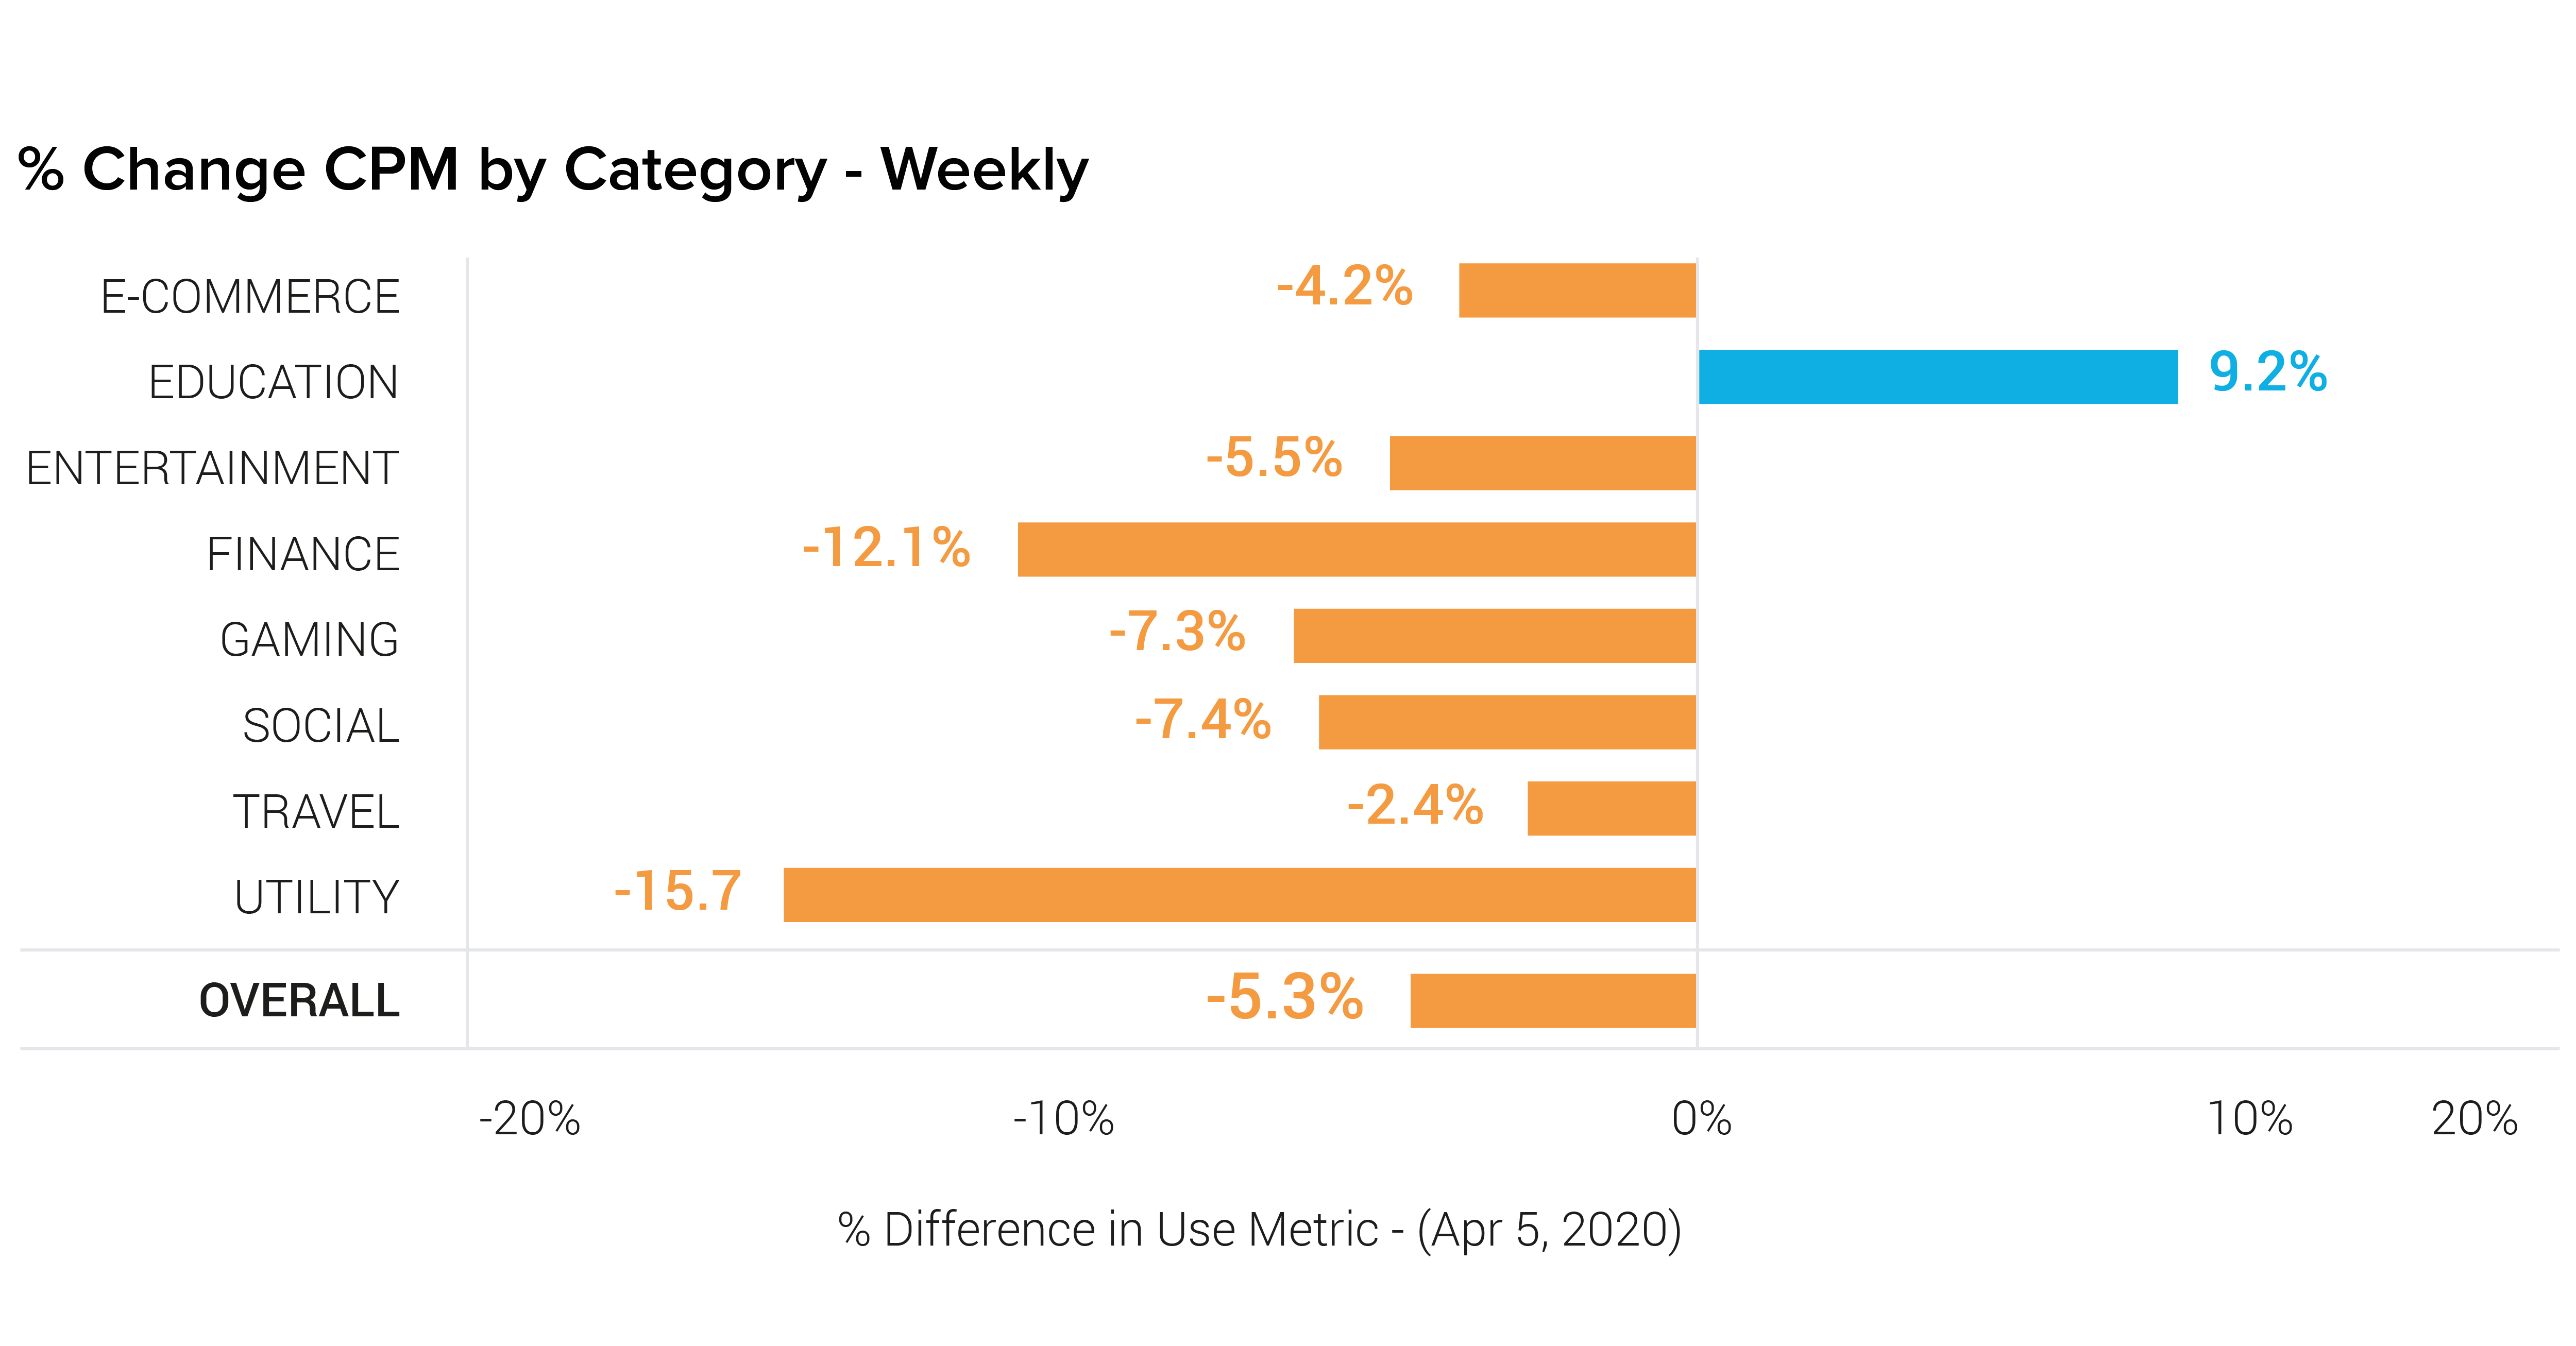
- Global CPMs dropped for the fourth consecutive week (-5.3%). All regions saw decreases in CPMs, although some were fairly small changes.
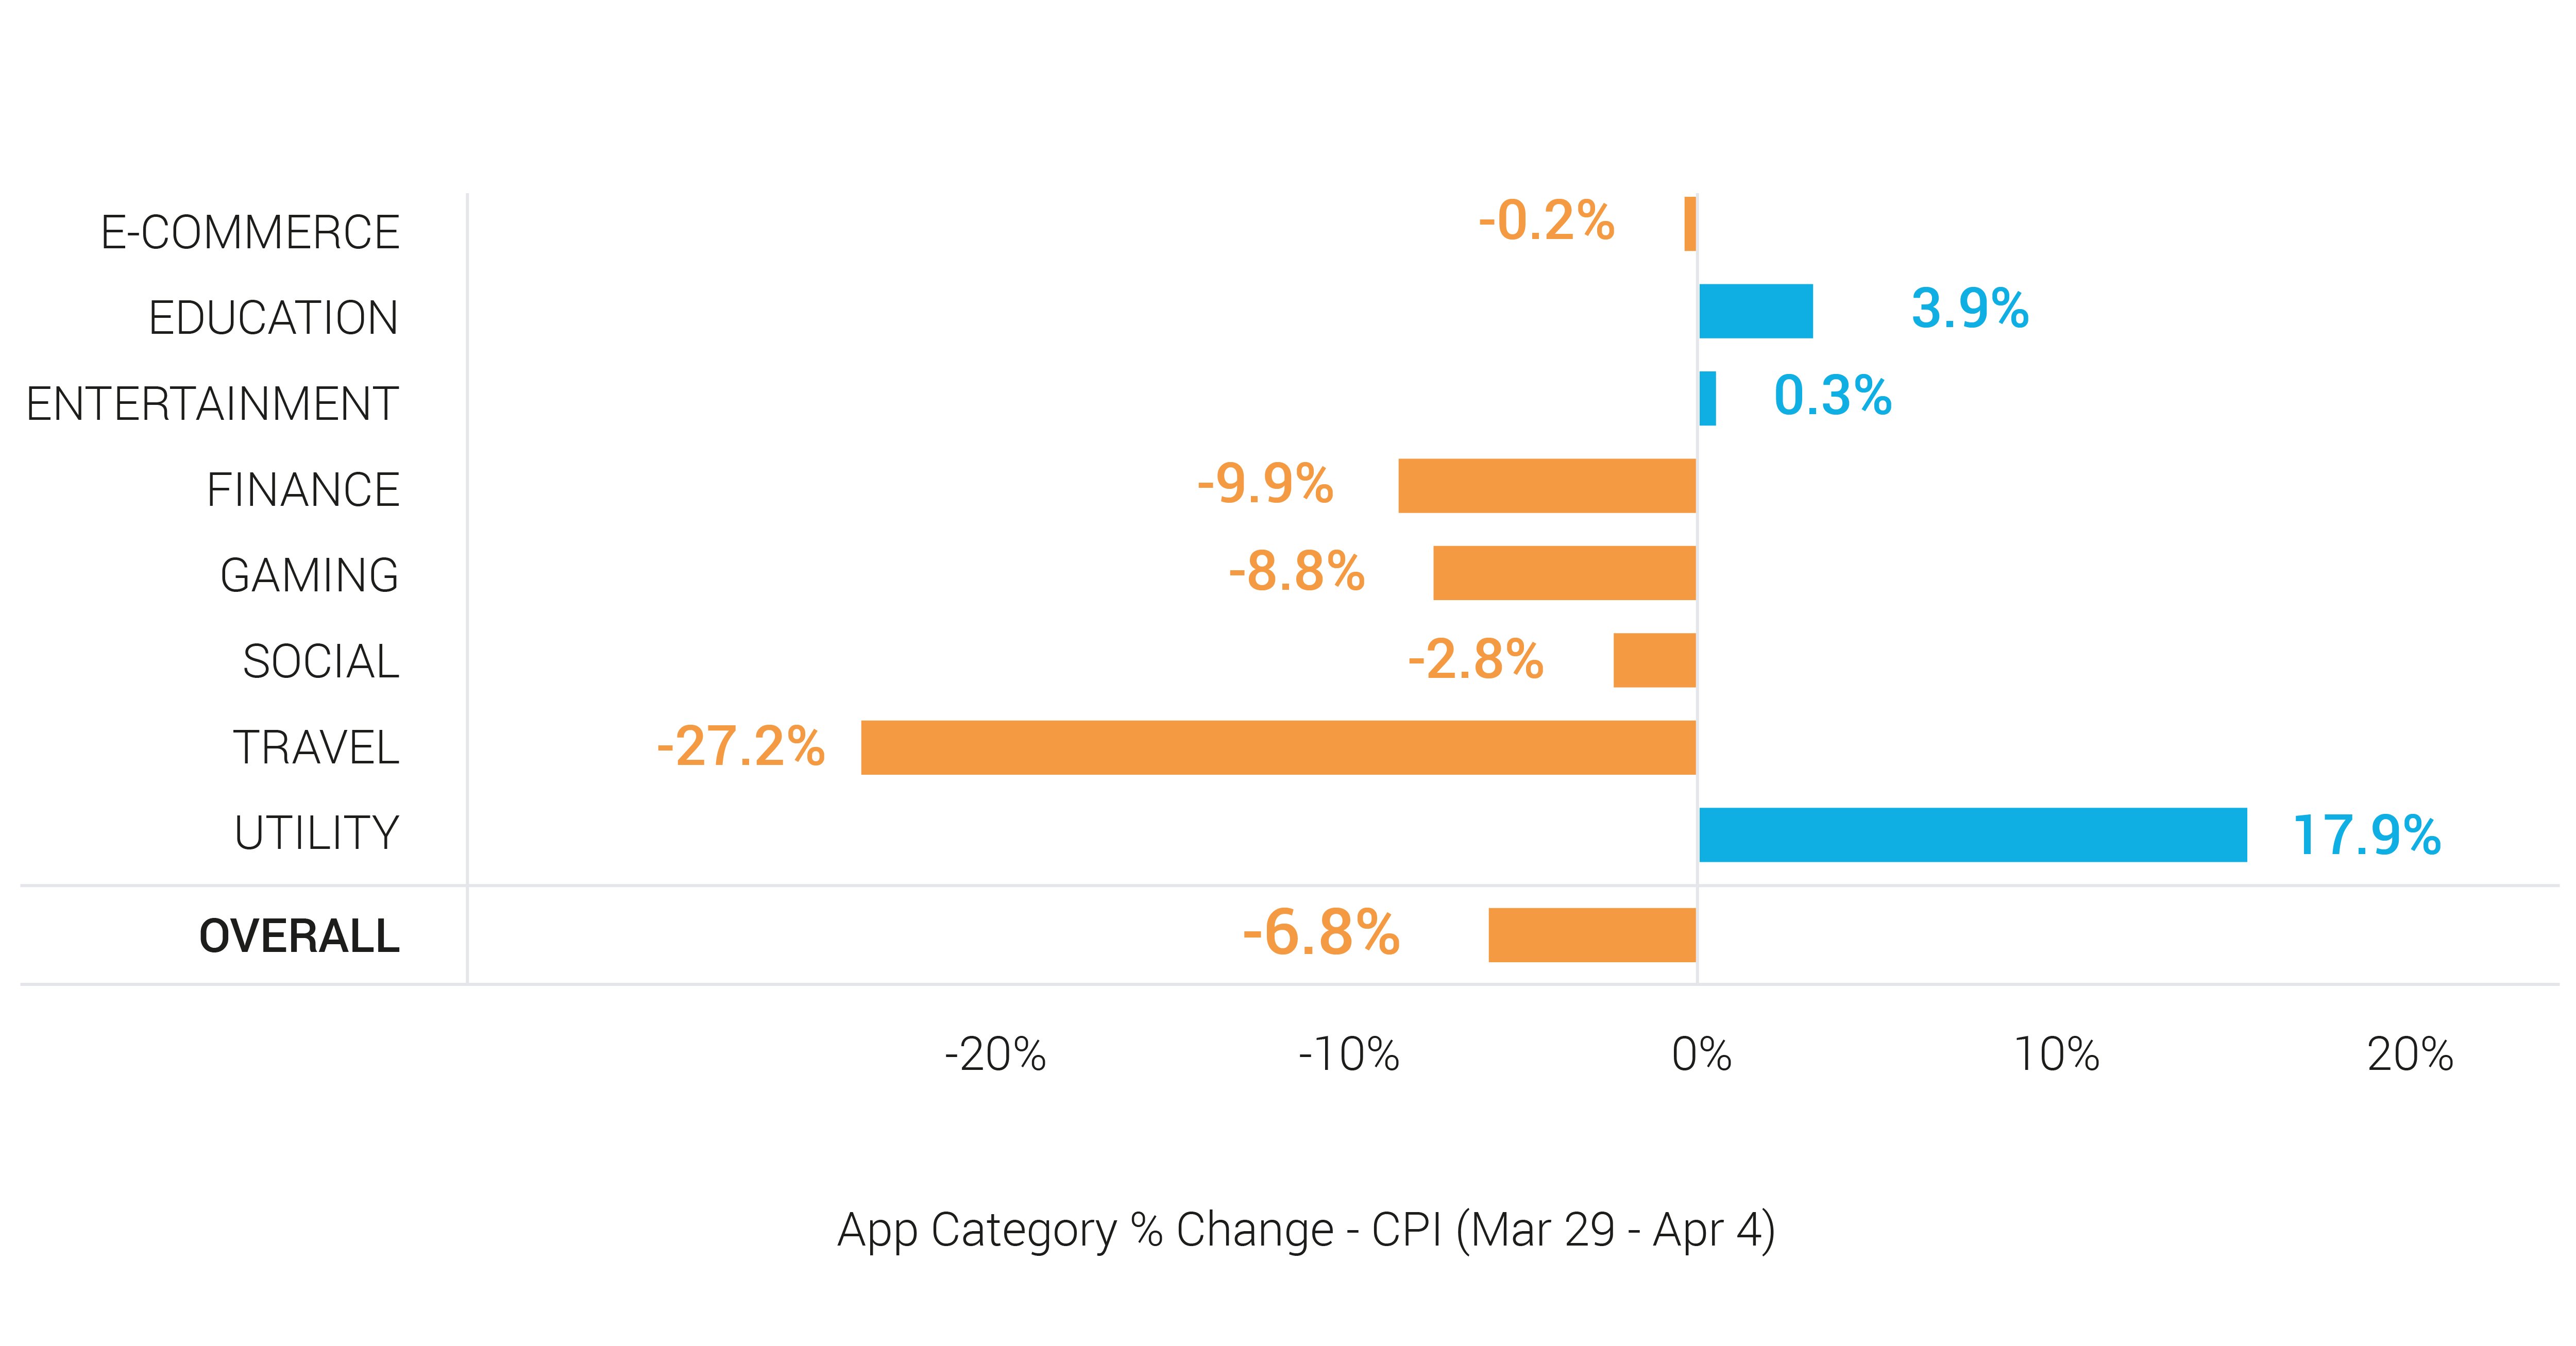
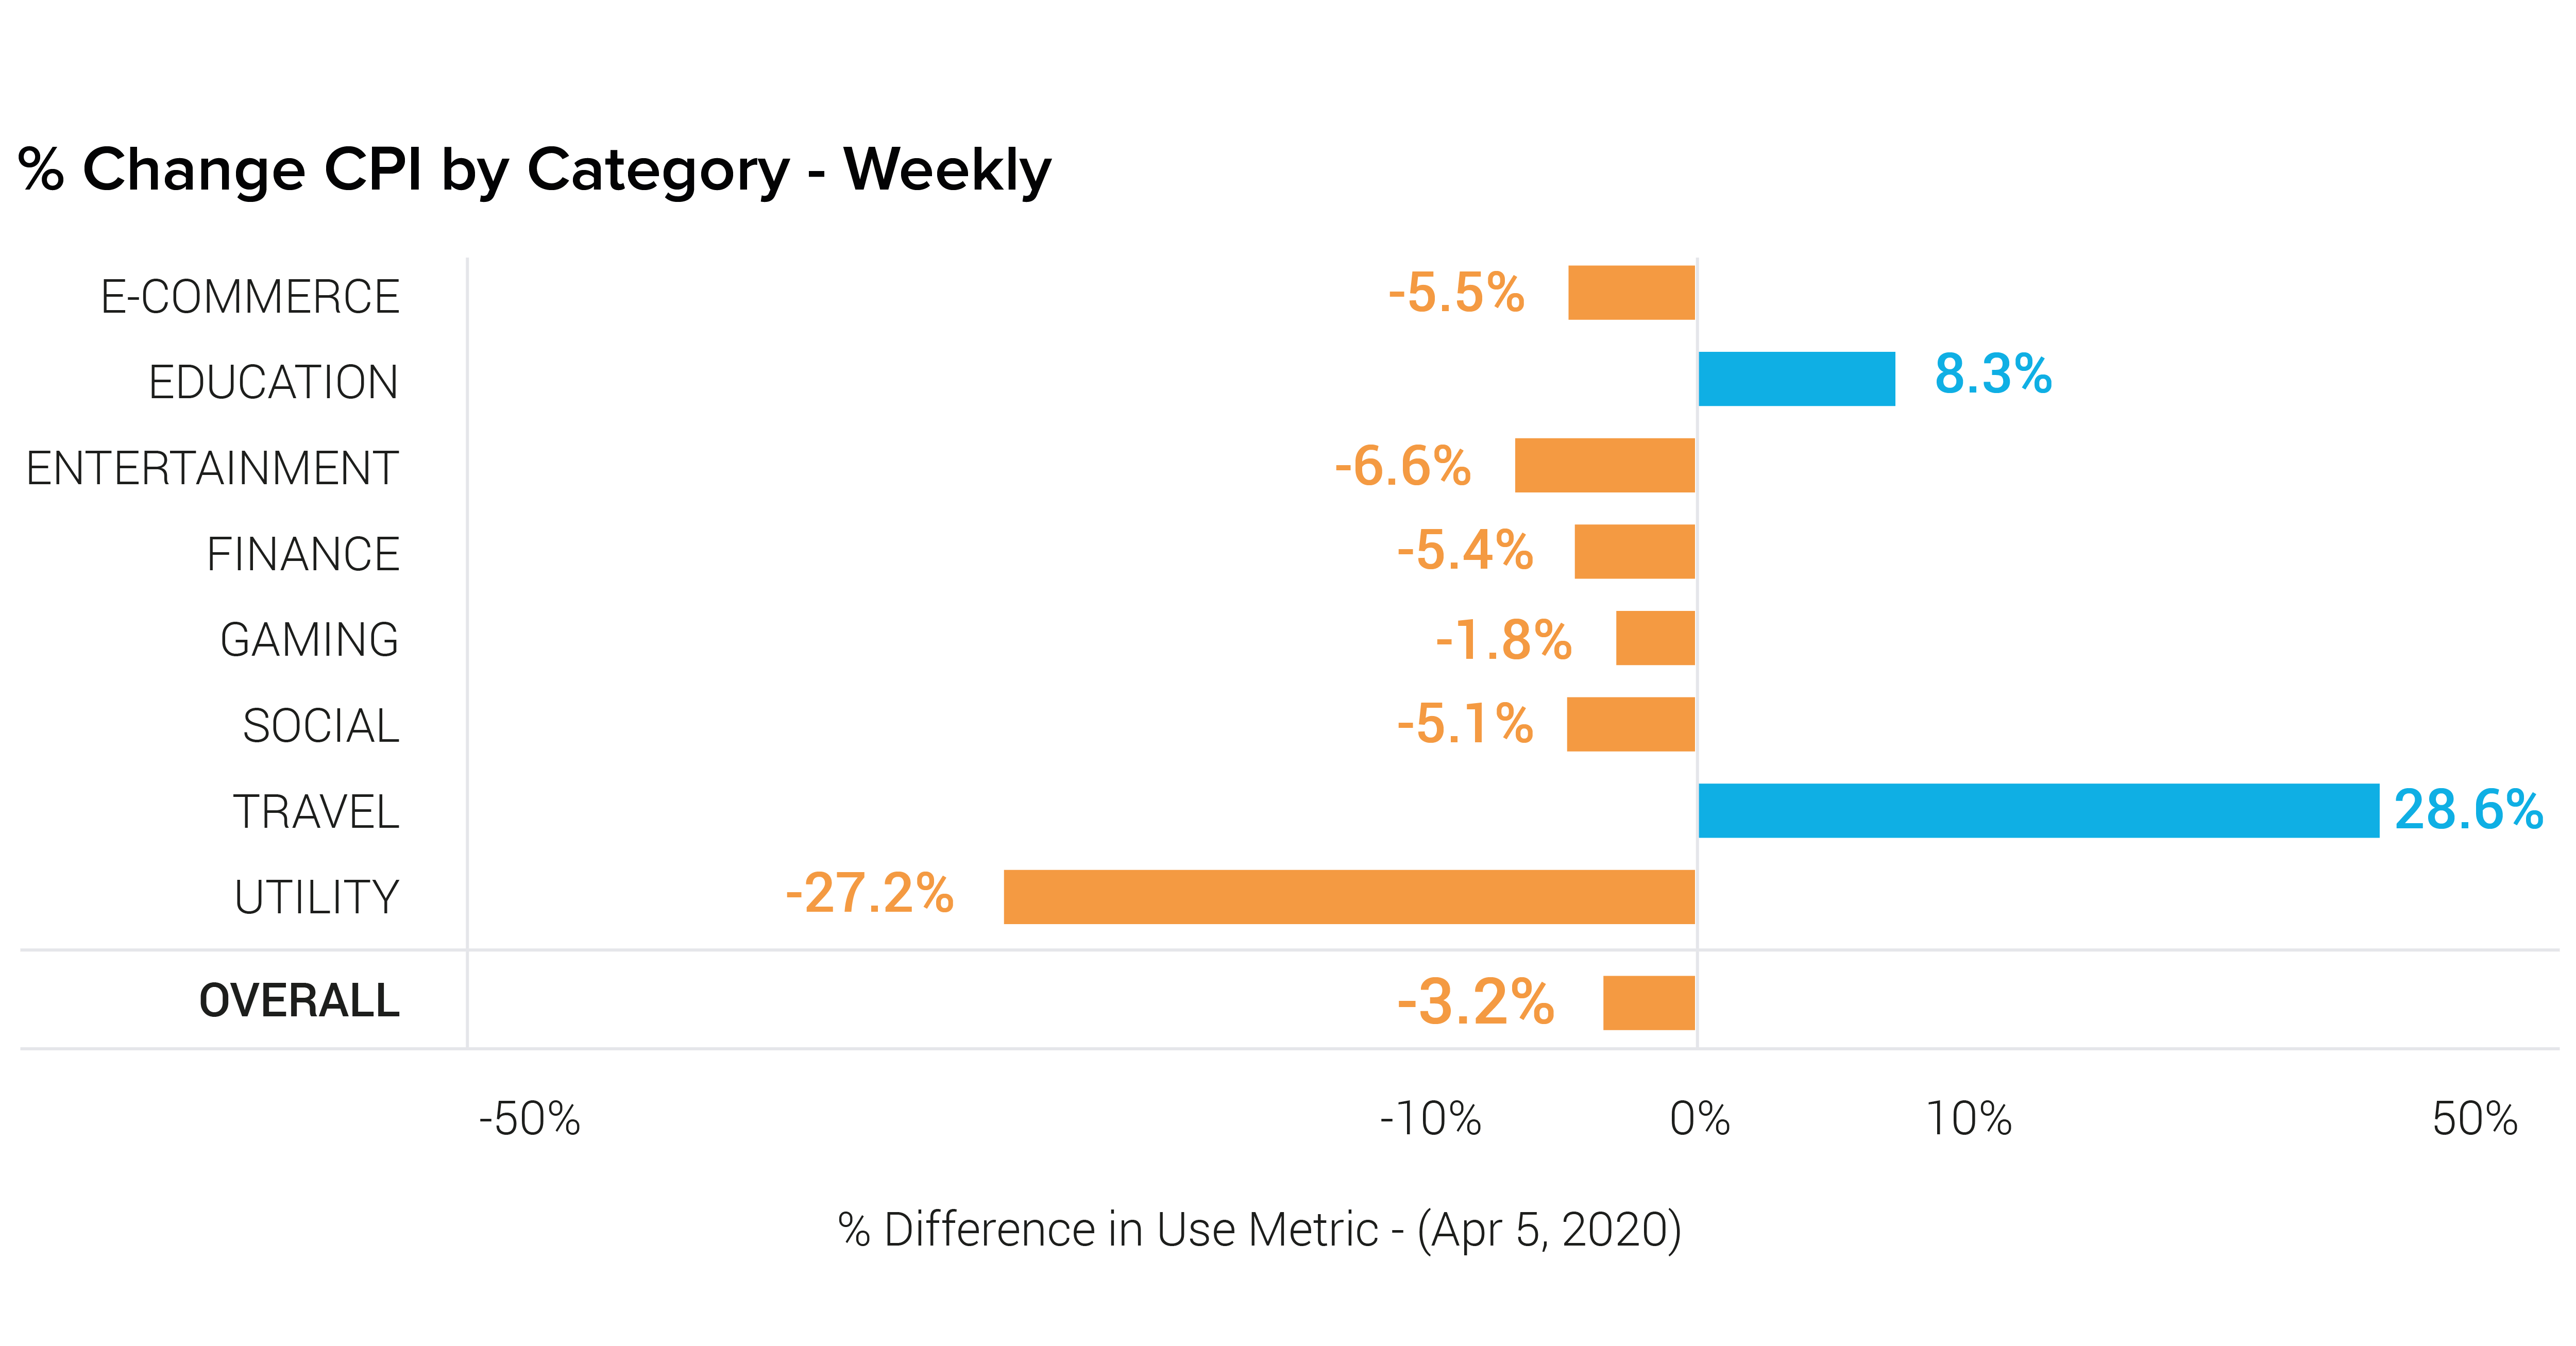
- Global CPIs dropped for another week as well (-3.2%). All app categories except for Education & Travel saw decreases in CPI. Travel CPIs continue to fluctuate considerably.
Bid Requests – % Change WoW
| Region | March 8 | March 15 | March 22 | March 29 | April 5 |
|---|---|---|---|---|---|
| APAC | -0.1% | 6.8% | 6.4% | 1.1% | 1.2% |
| EMEA | -4.0% | 11.2% | 5.2% | 1.6% | 4.6% |
| LATAM | -3.6% | 19.9% | 12.5% | -2.3% | 4.6% |
| NAR | -0.2% | 12.4% | 3.1% | 1.2% | 5.9% |
| Overall | -1.8% | 11.2% | 5.7% | 0.8% | 4.0% |
CPM
CPI
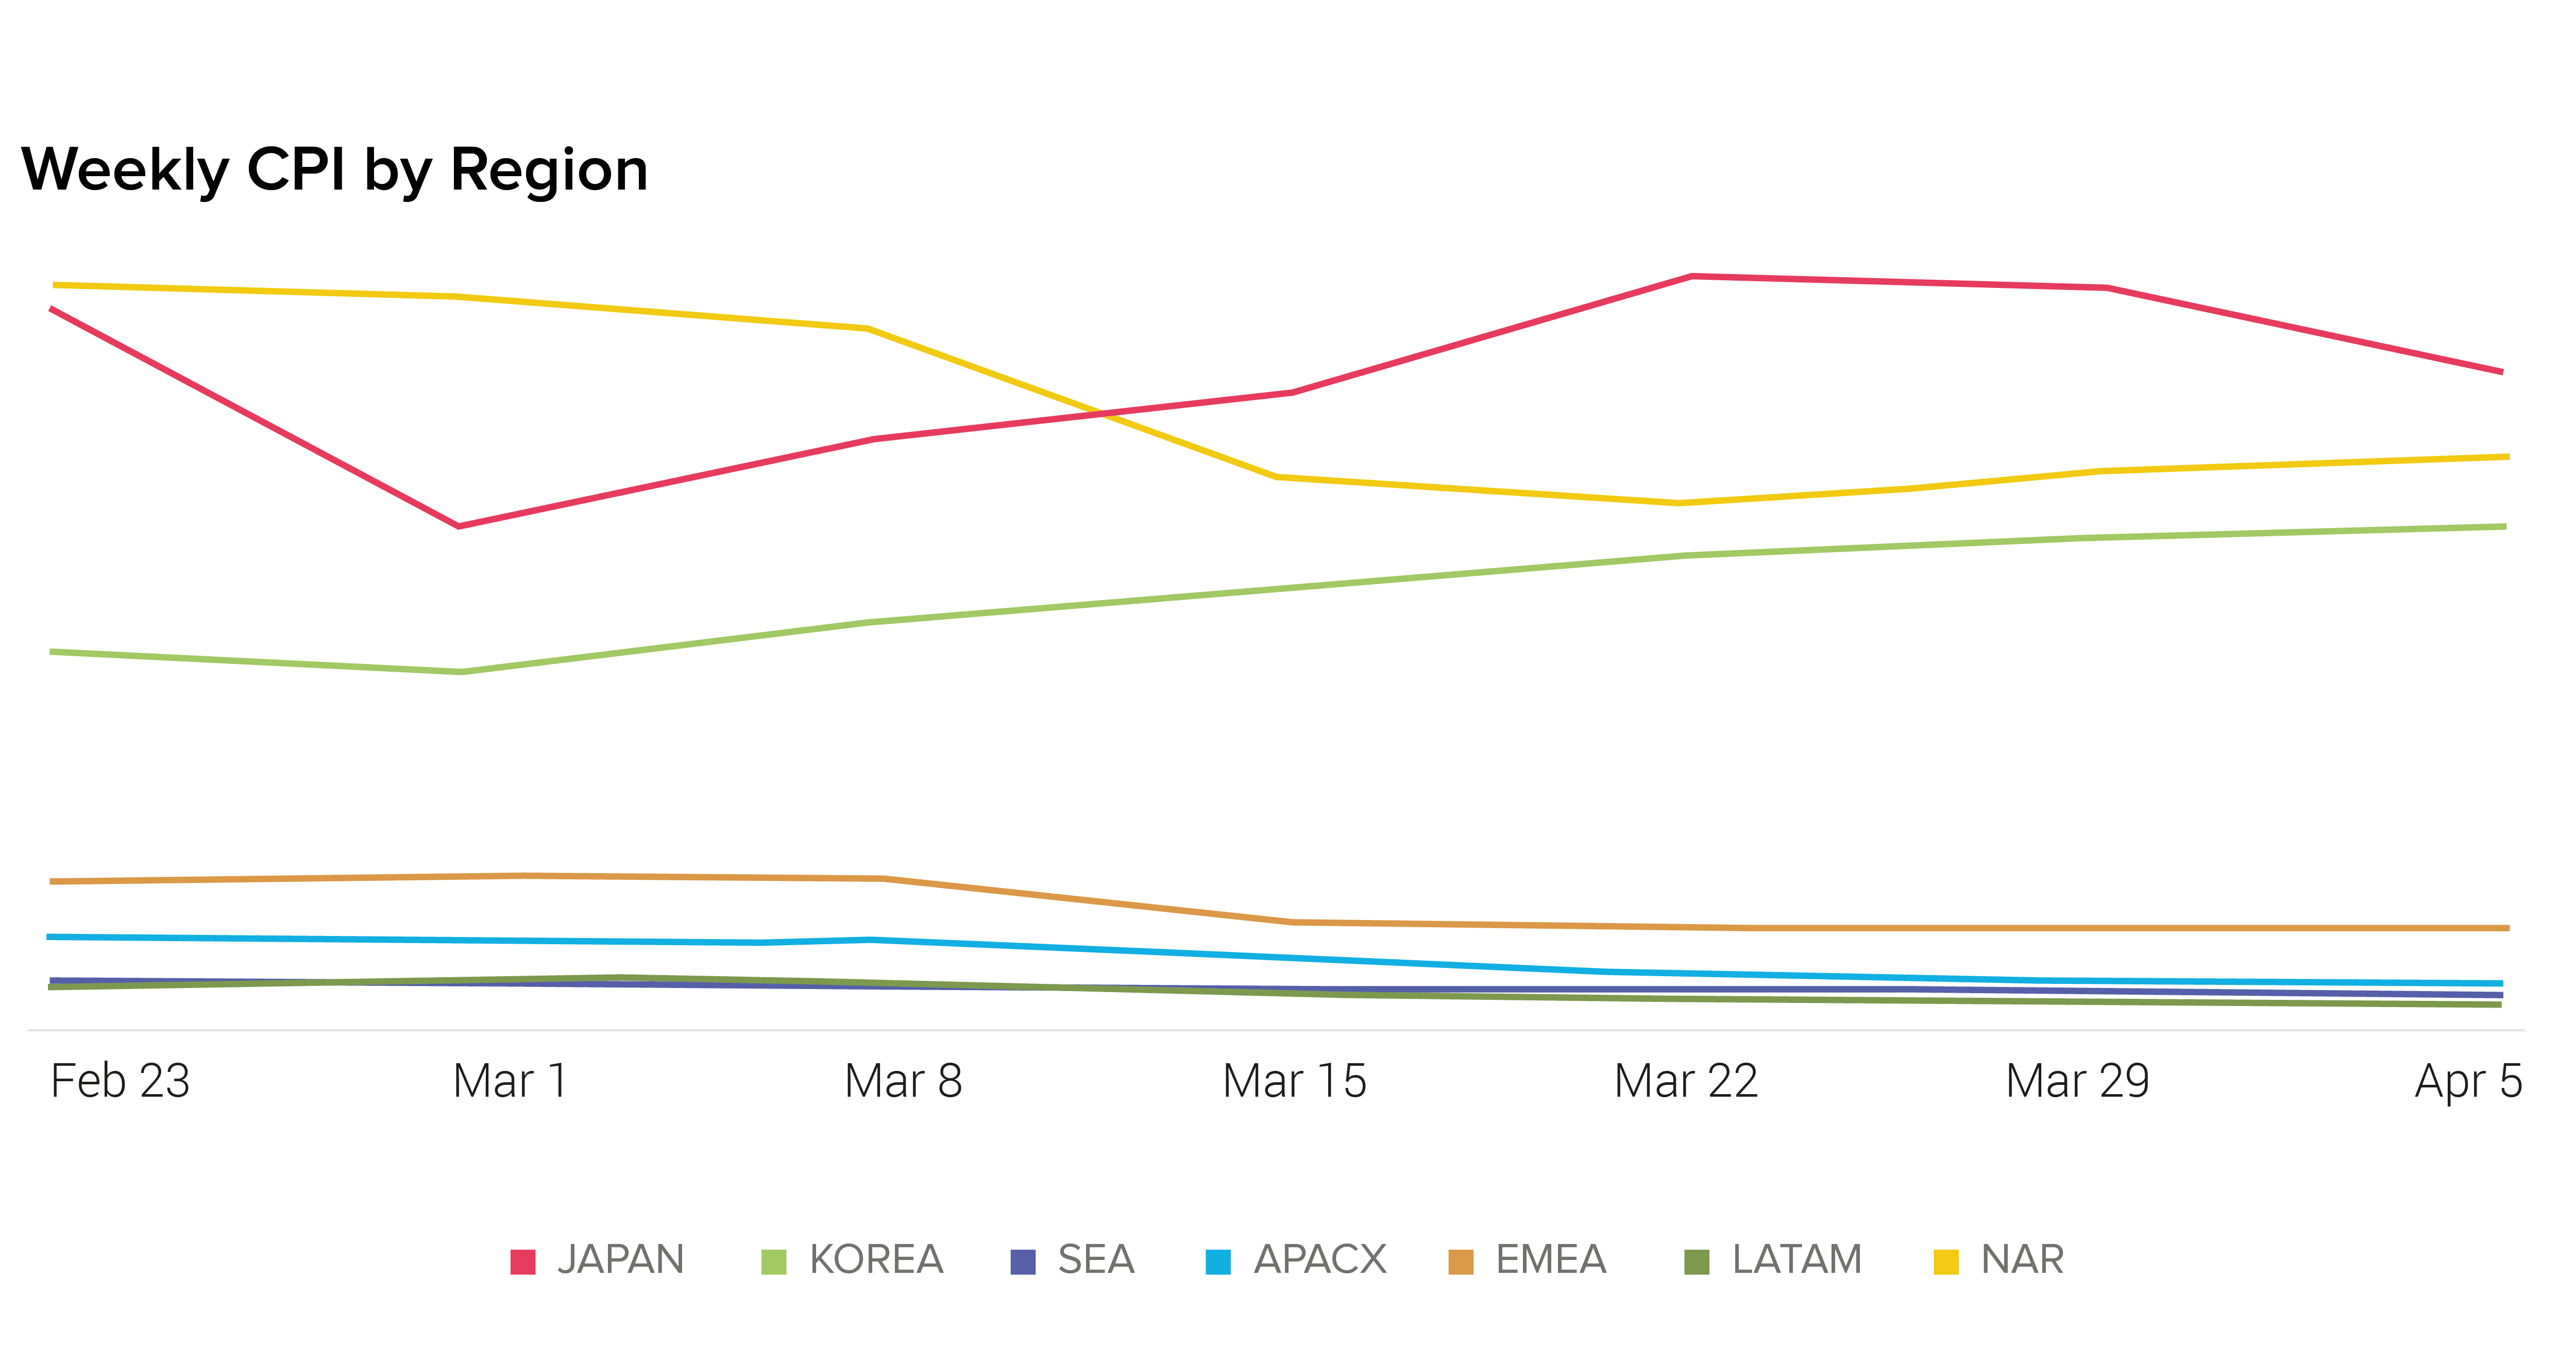
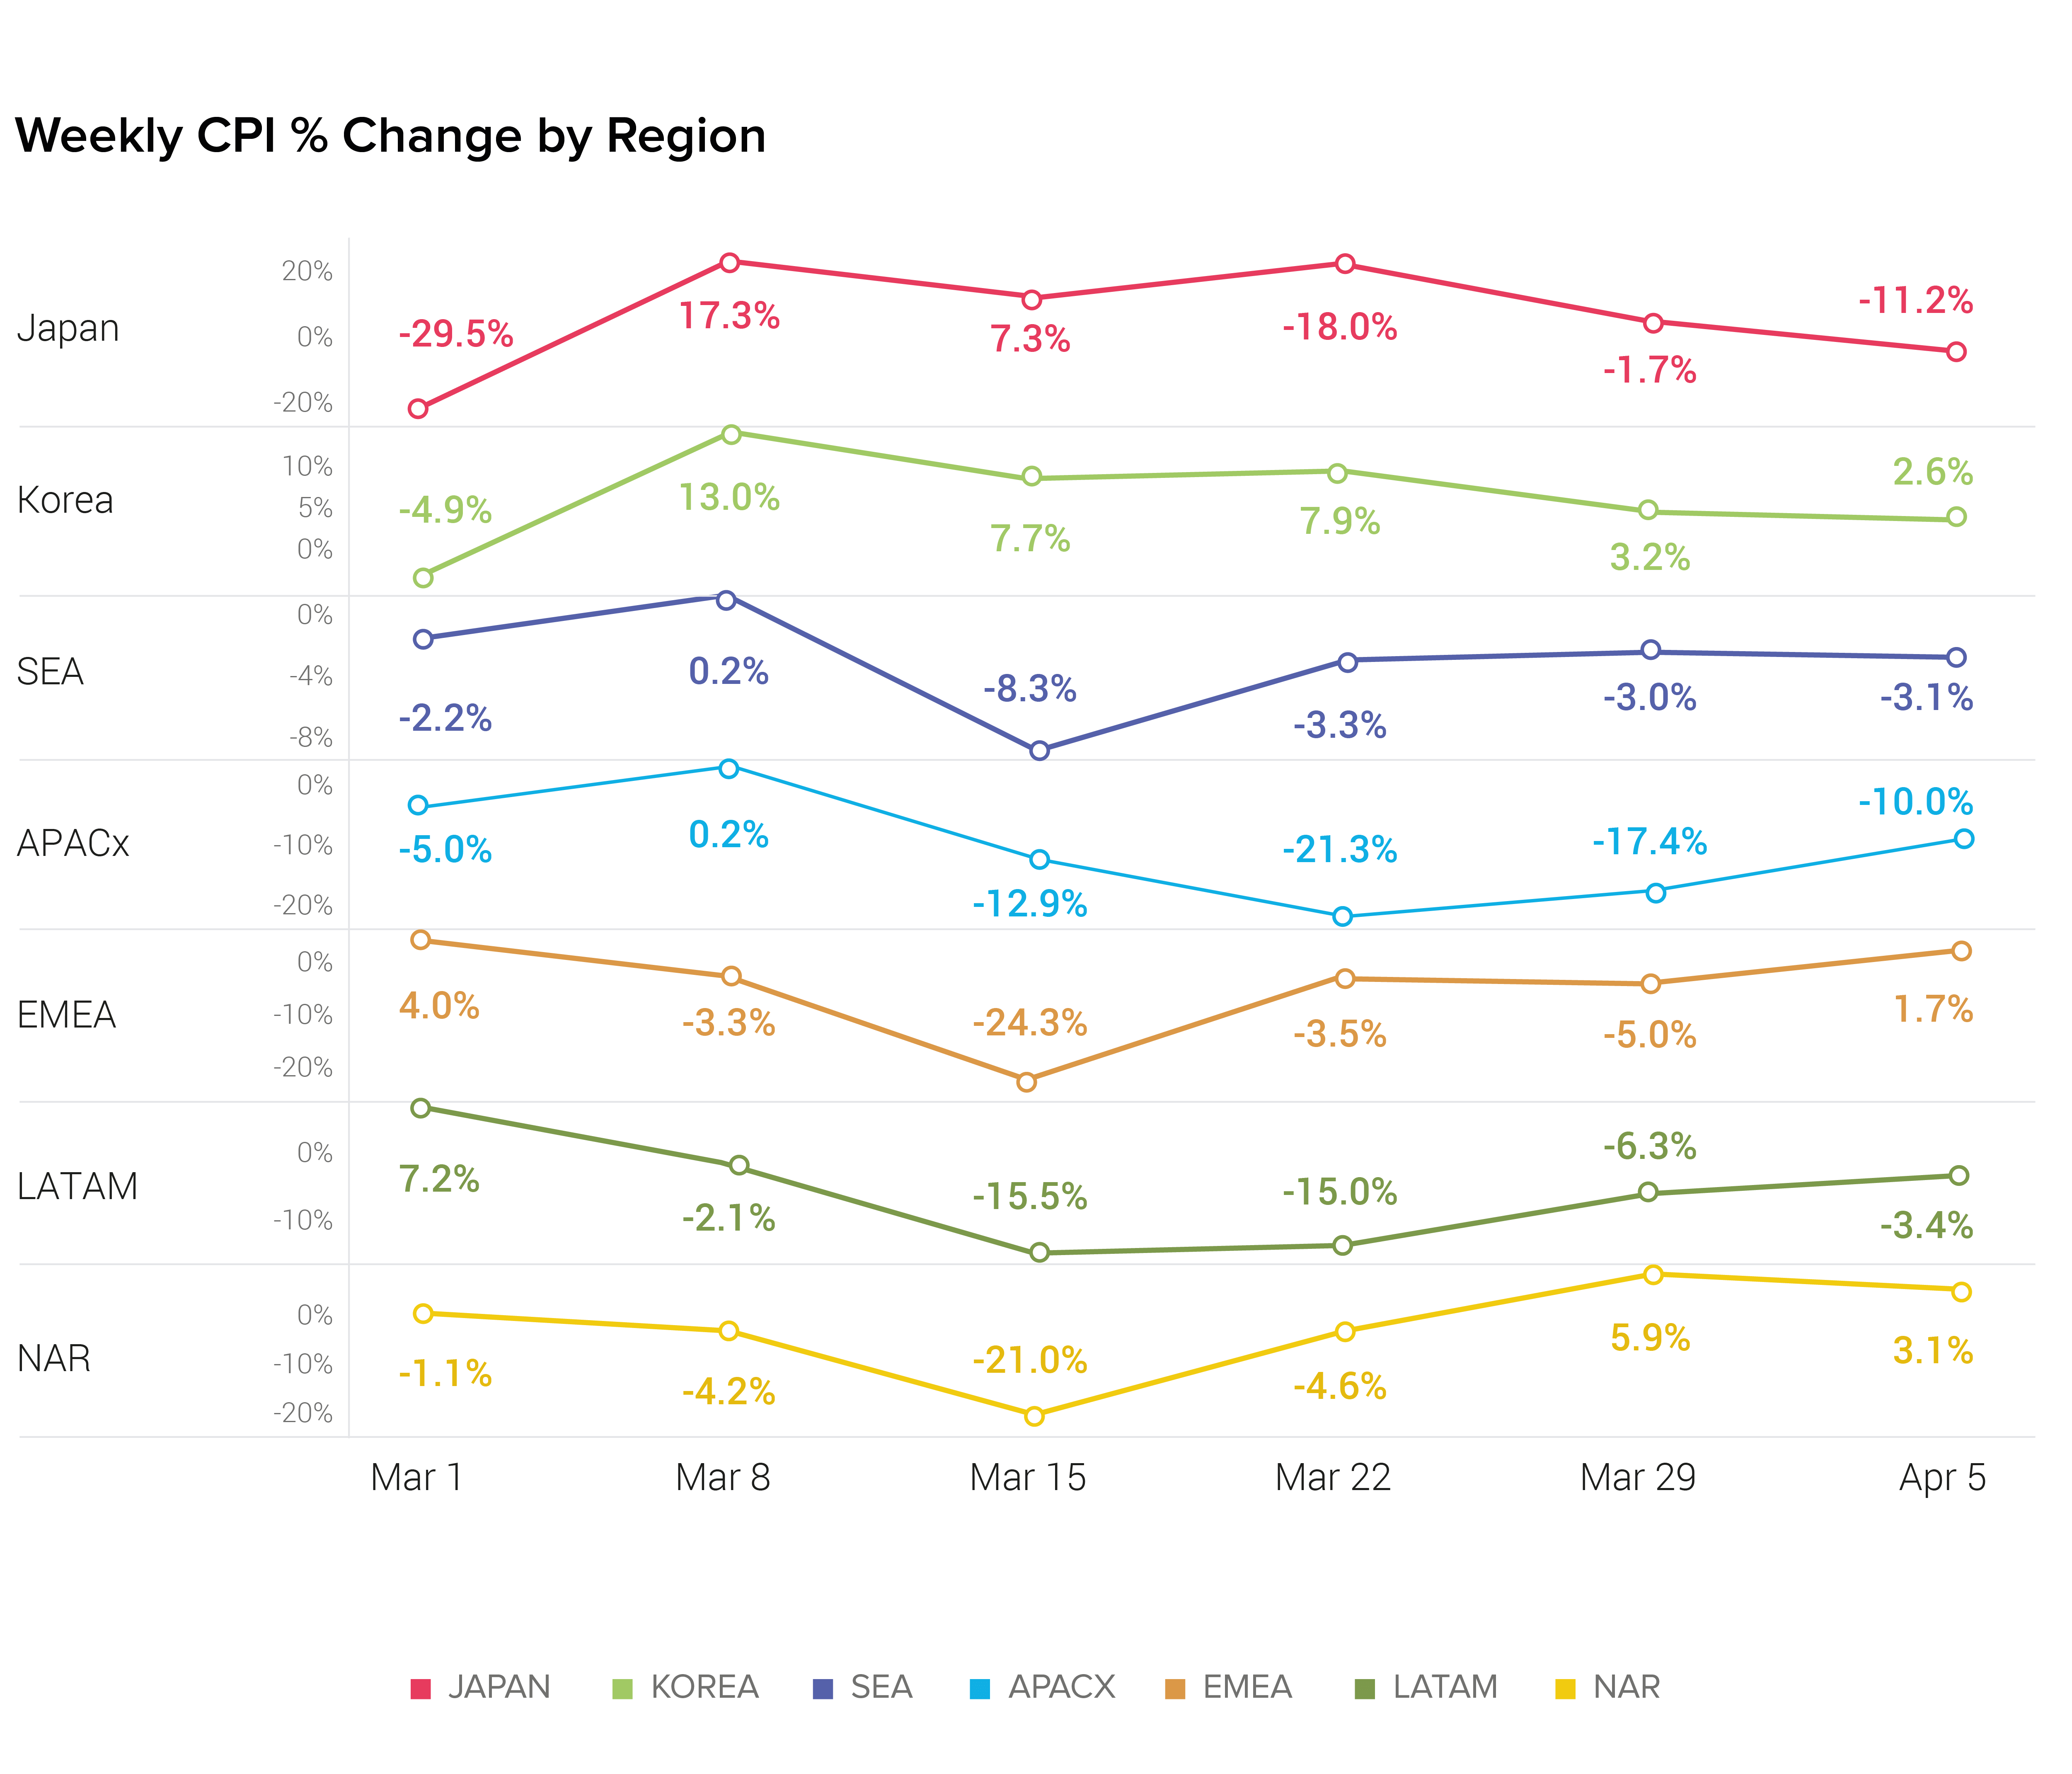
Note: APACX includes APAC as a region and excludes Japan, Korea and Southeast Asia.
April 7, 2020
Many of us have questions on the impact COVID-19 and the work and live-at home situation is having on the mobile advertising ecosystem. Are in-app inventory costs decreasing as a result of some app verticals pulling back ad spend? Are consumers engaging with ads and installing apps at a higher rate than normal? Are there differences by app category or region? The team here at Liftoff wants to keep you informed so today we are launching the COVID-19 Mobile Ad Performance Tracker (MAPT).
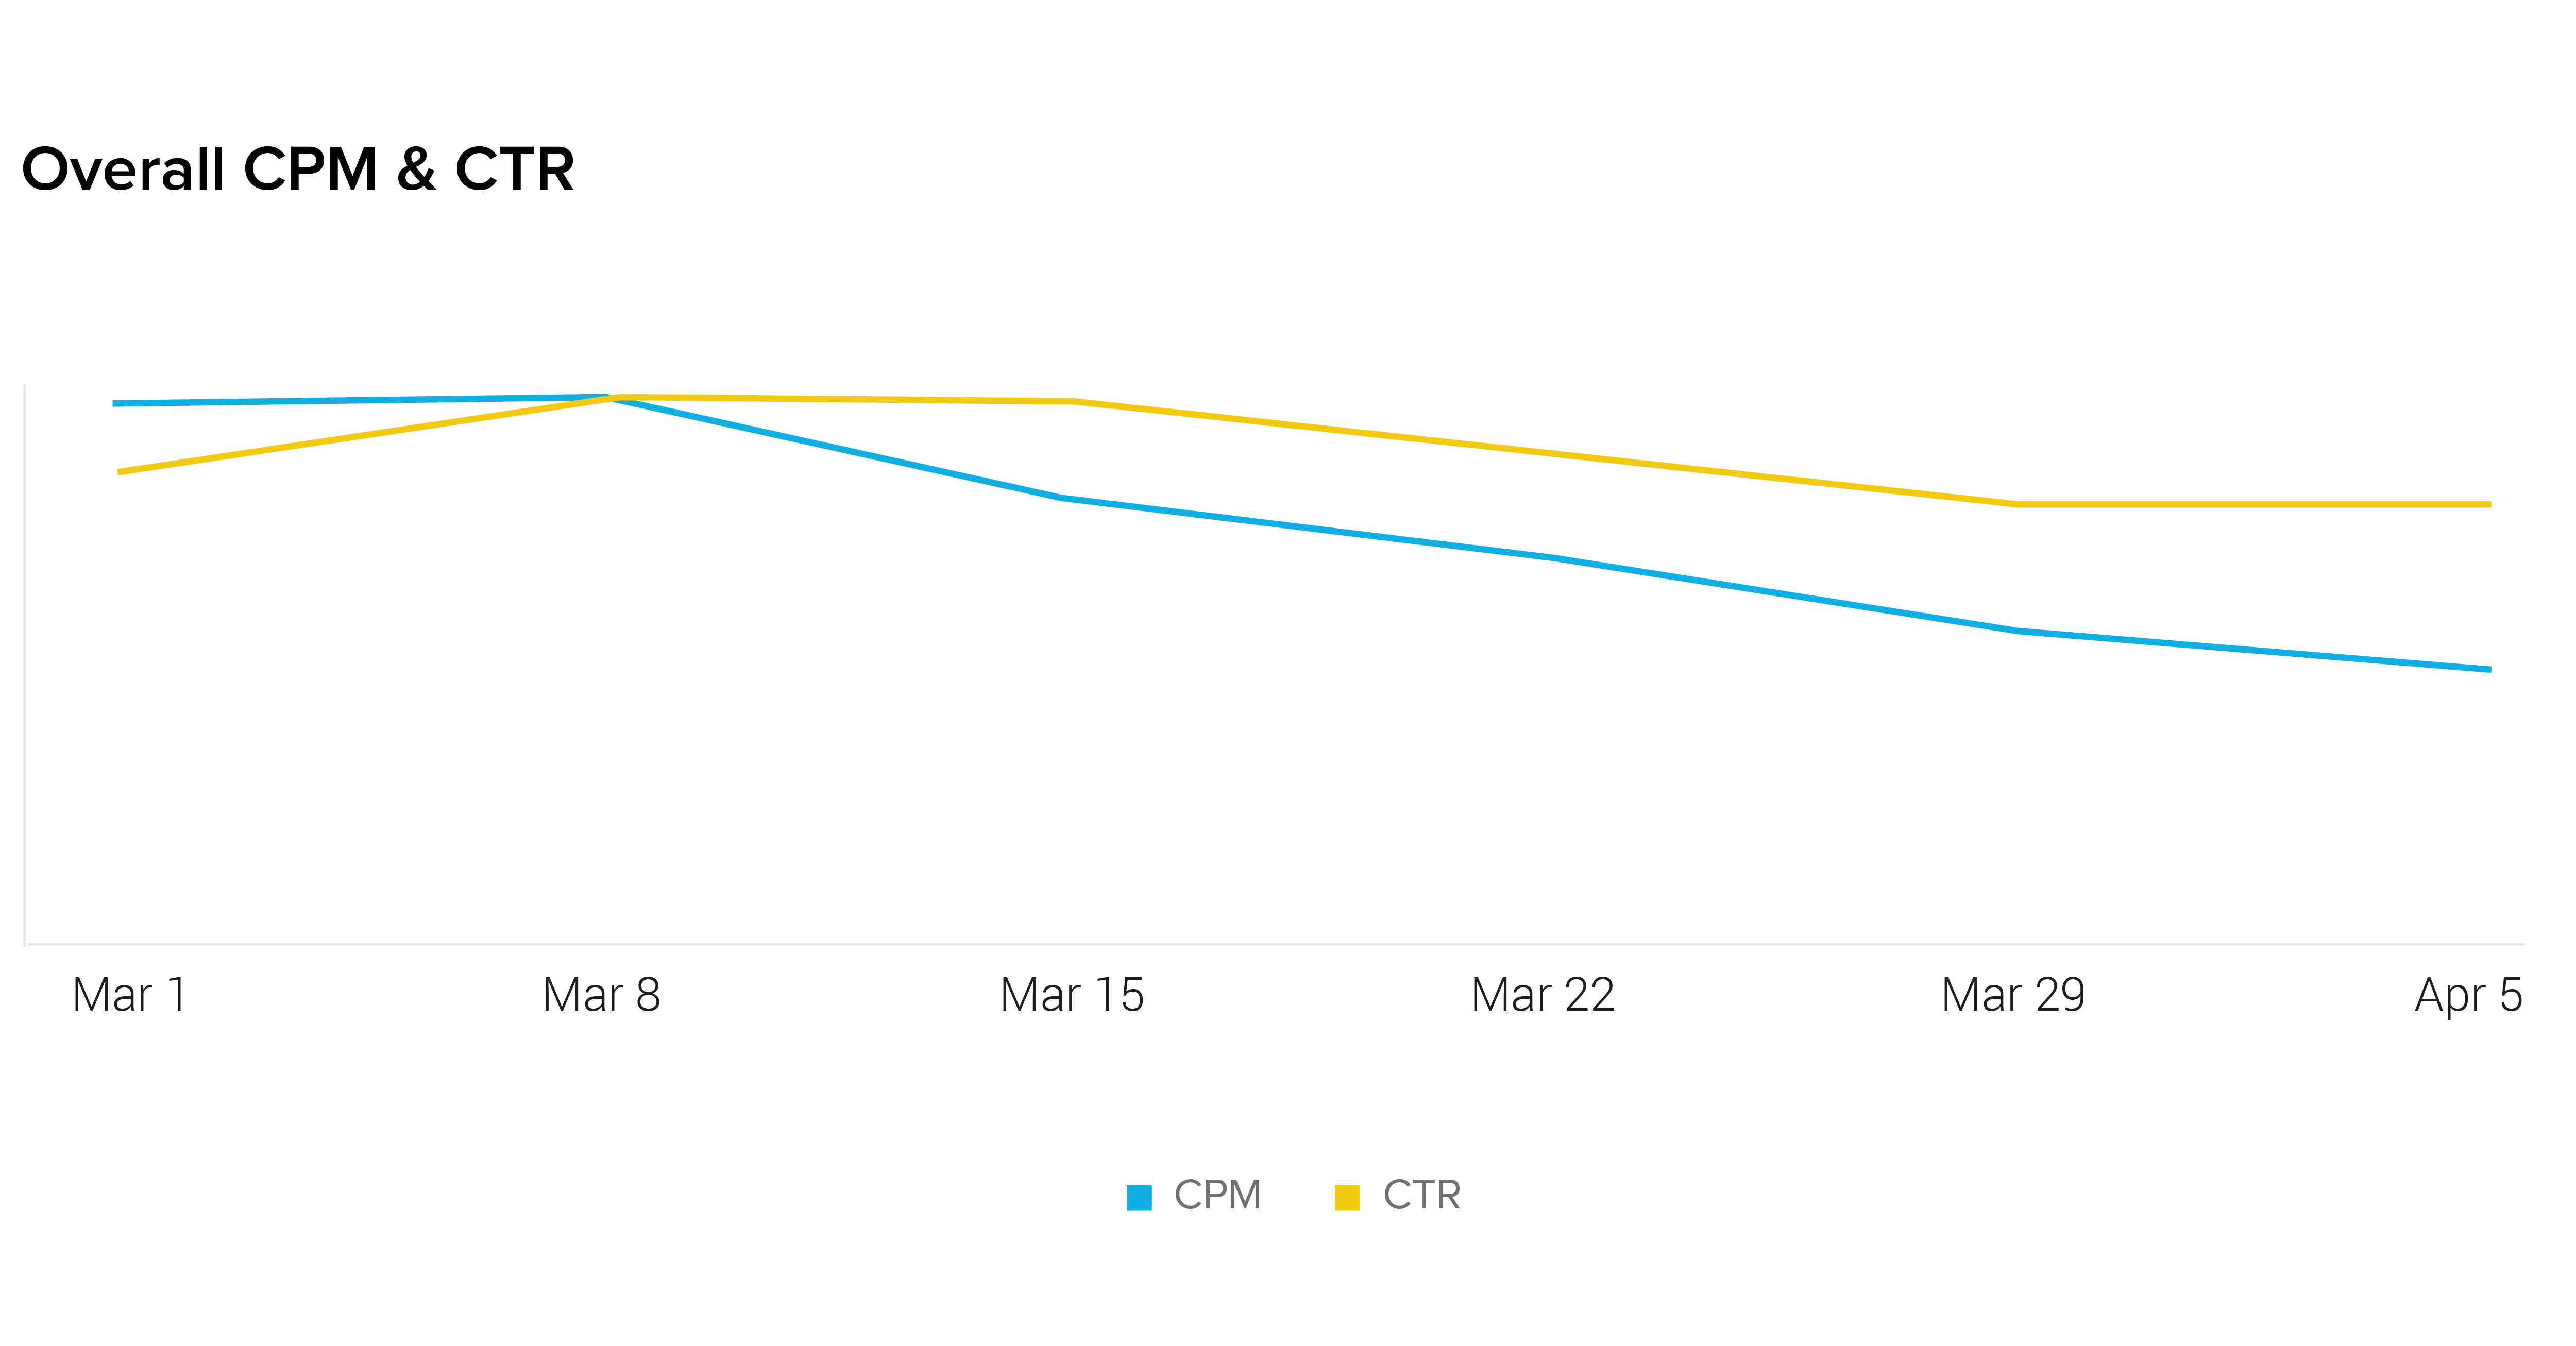
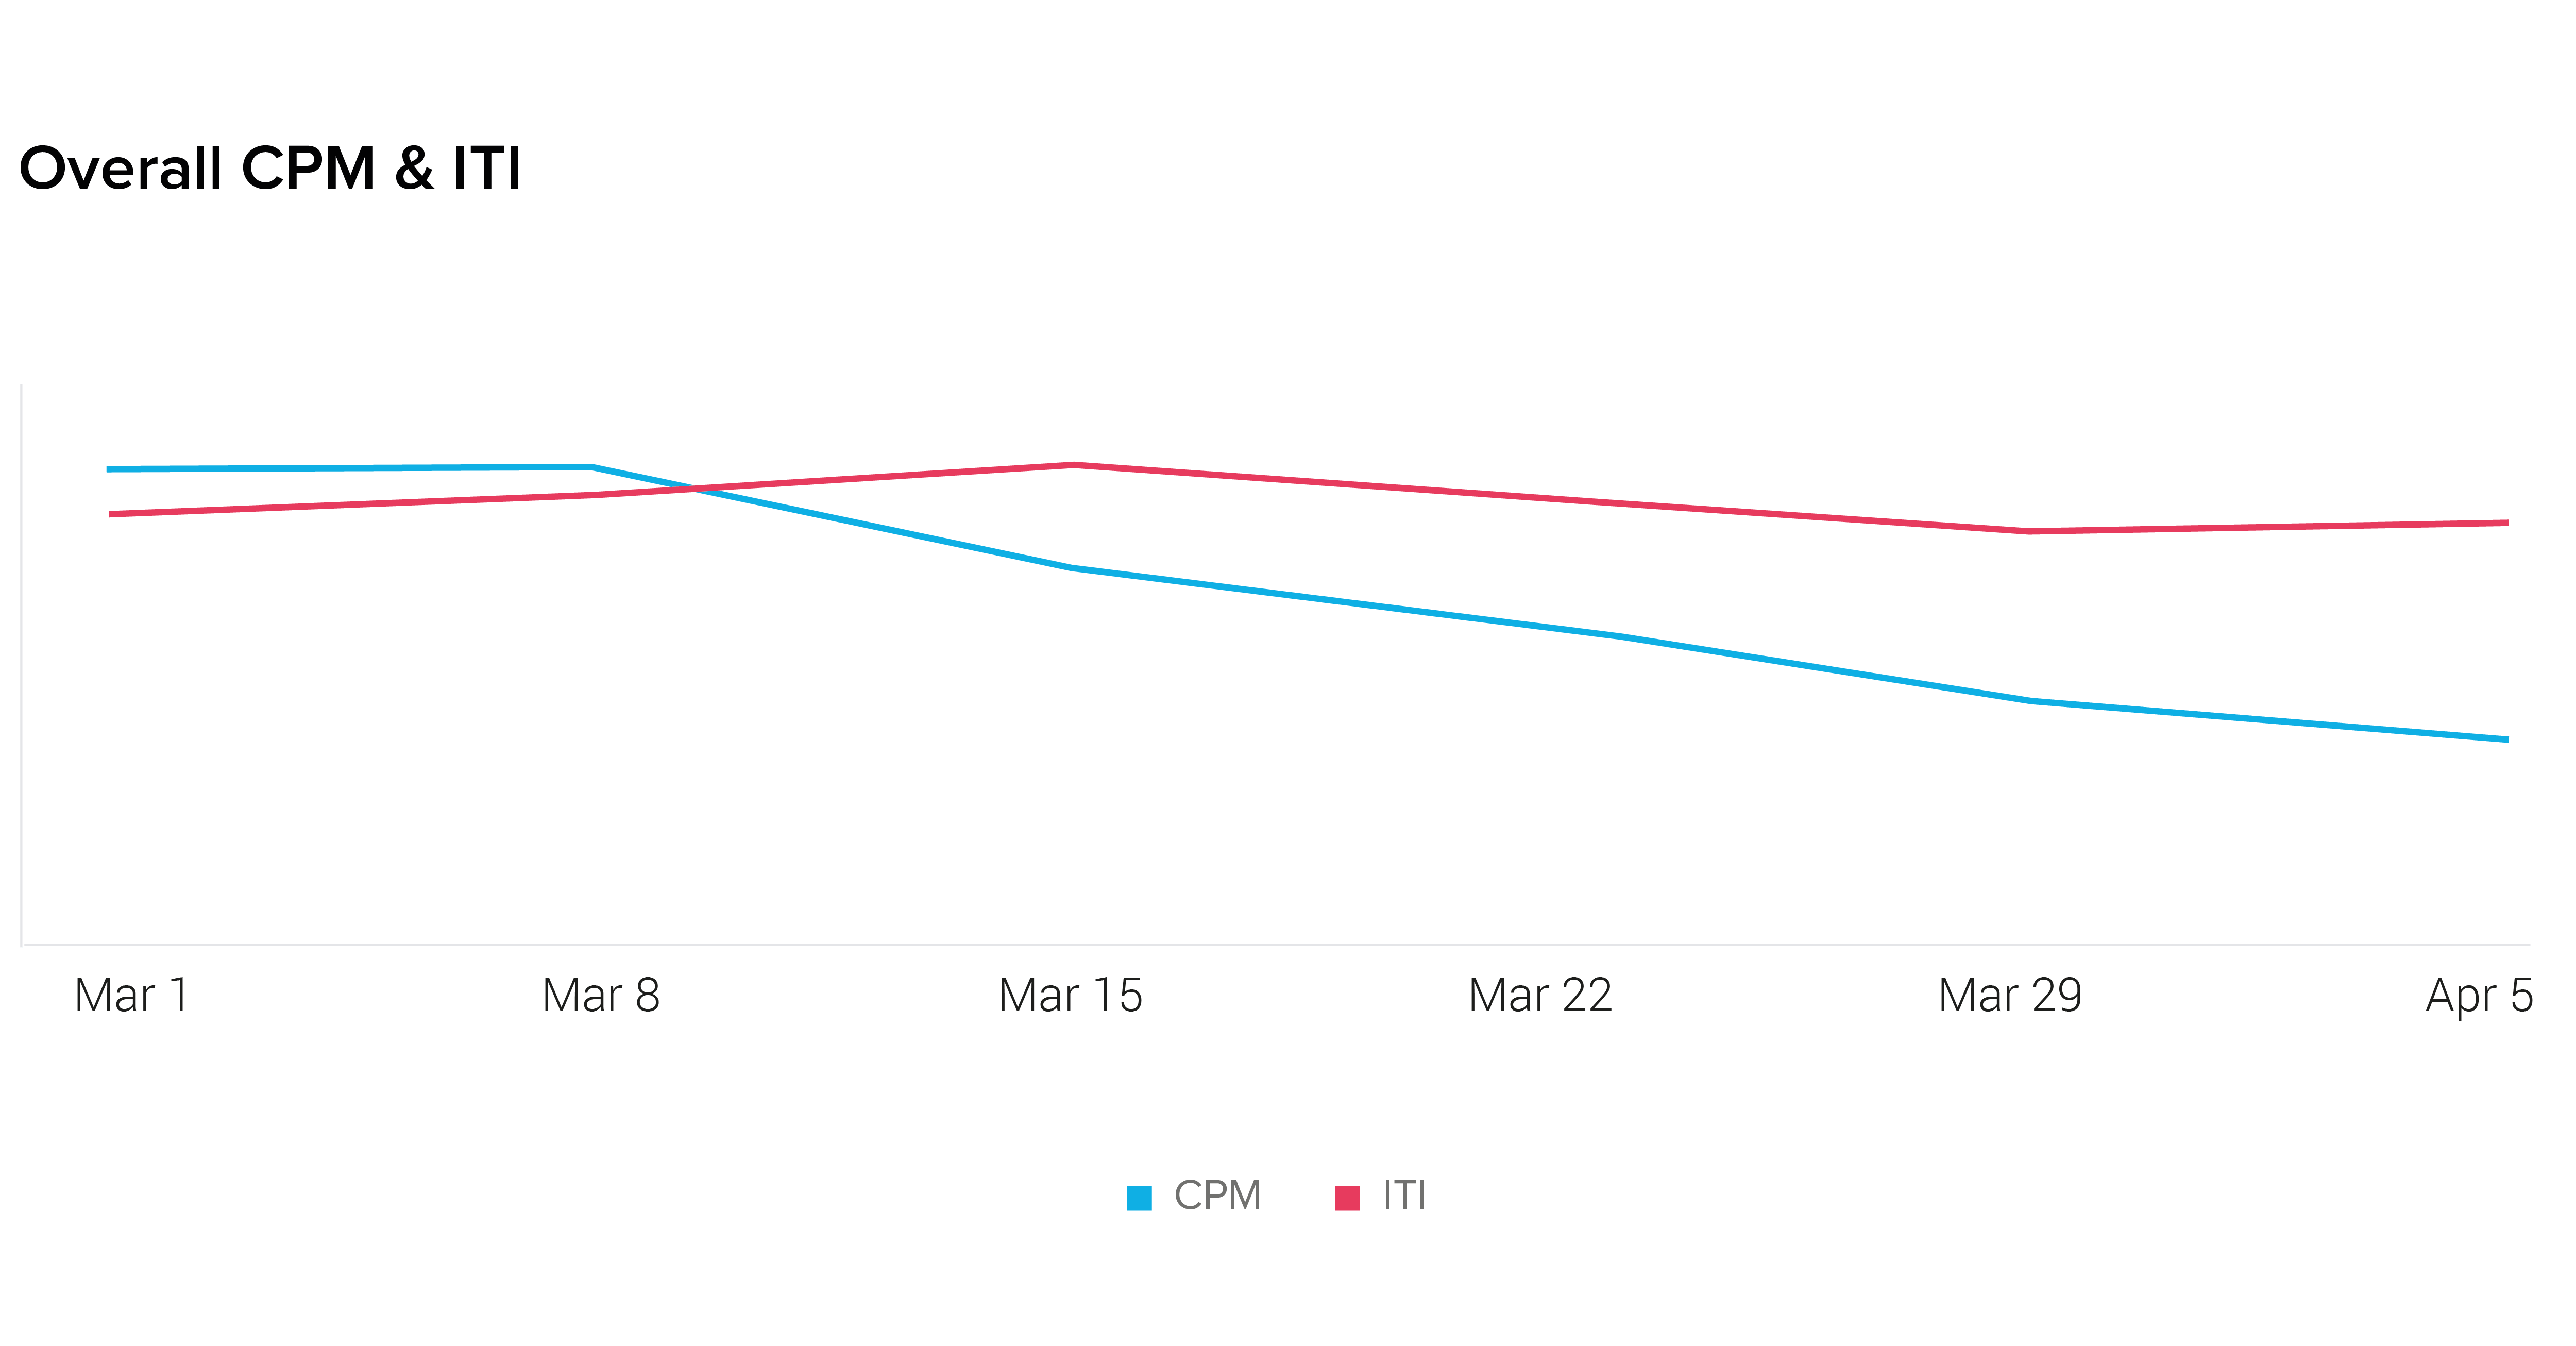
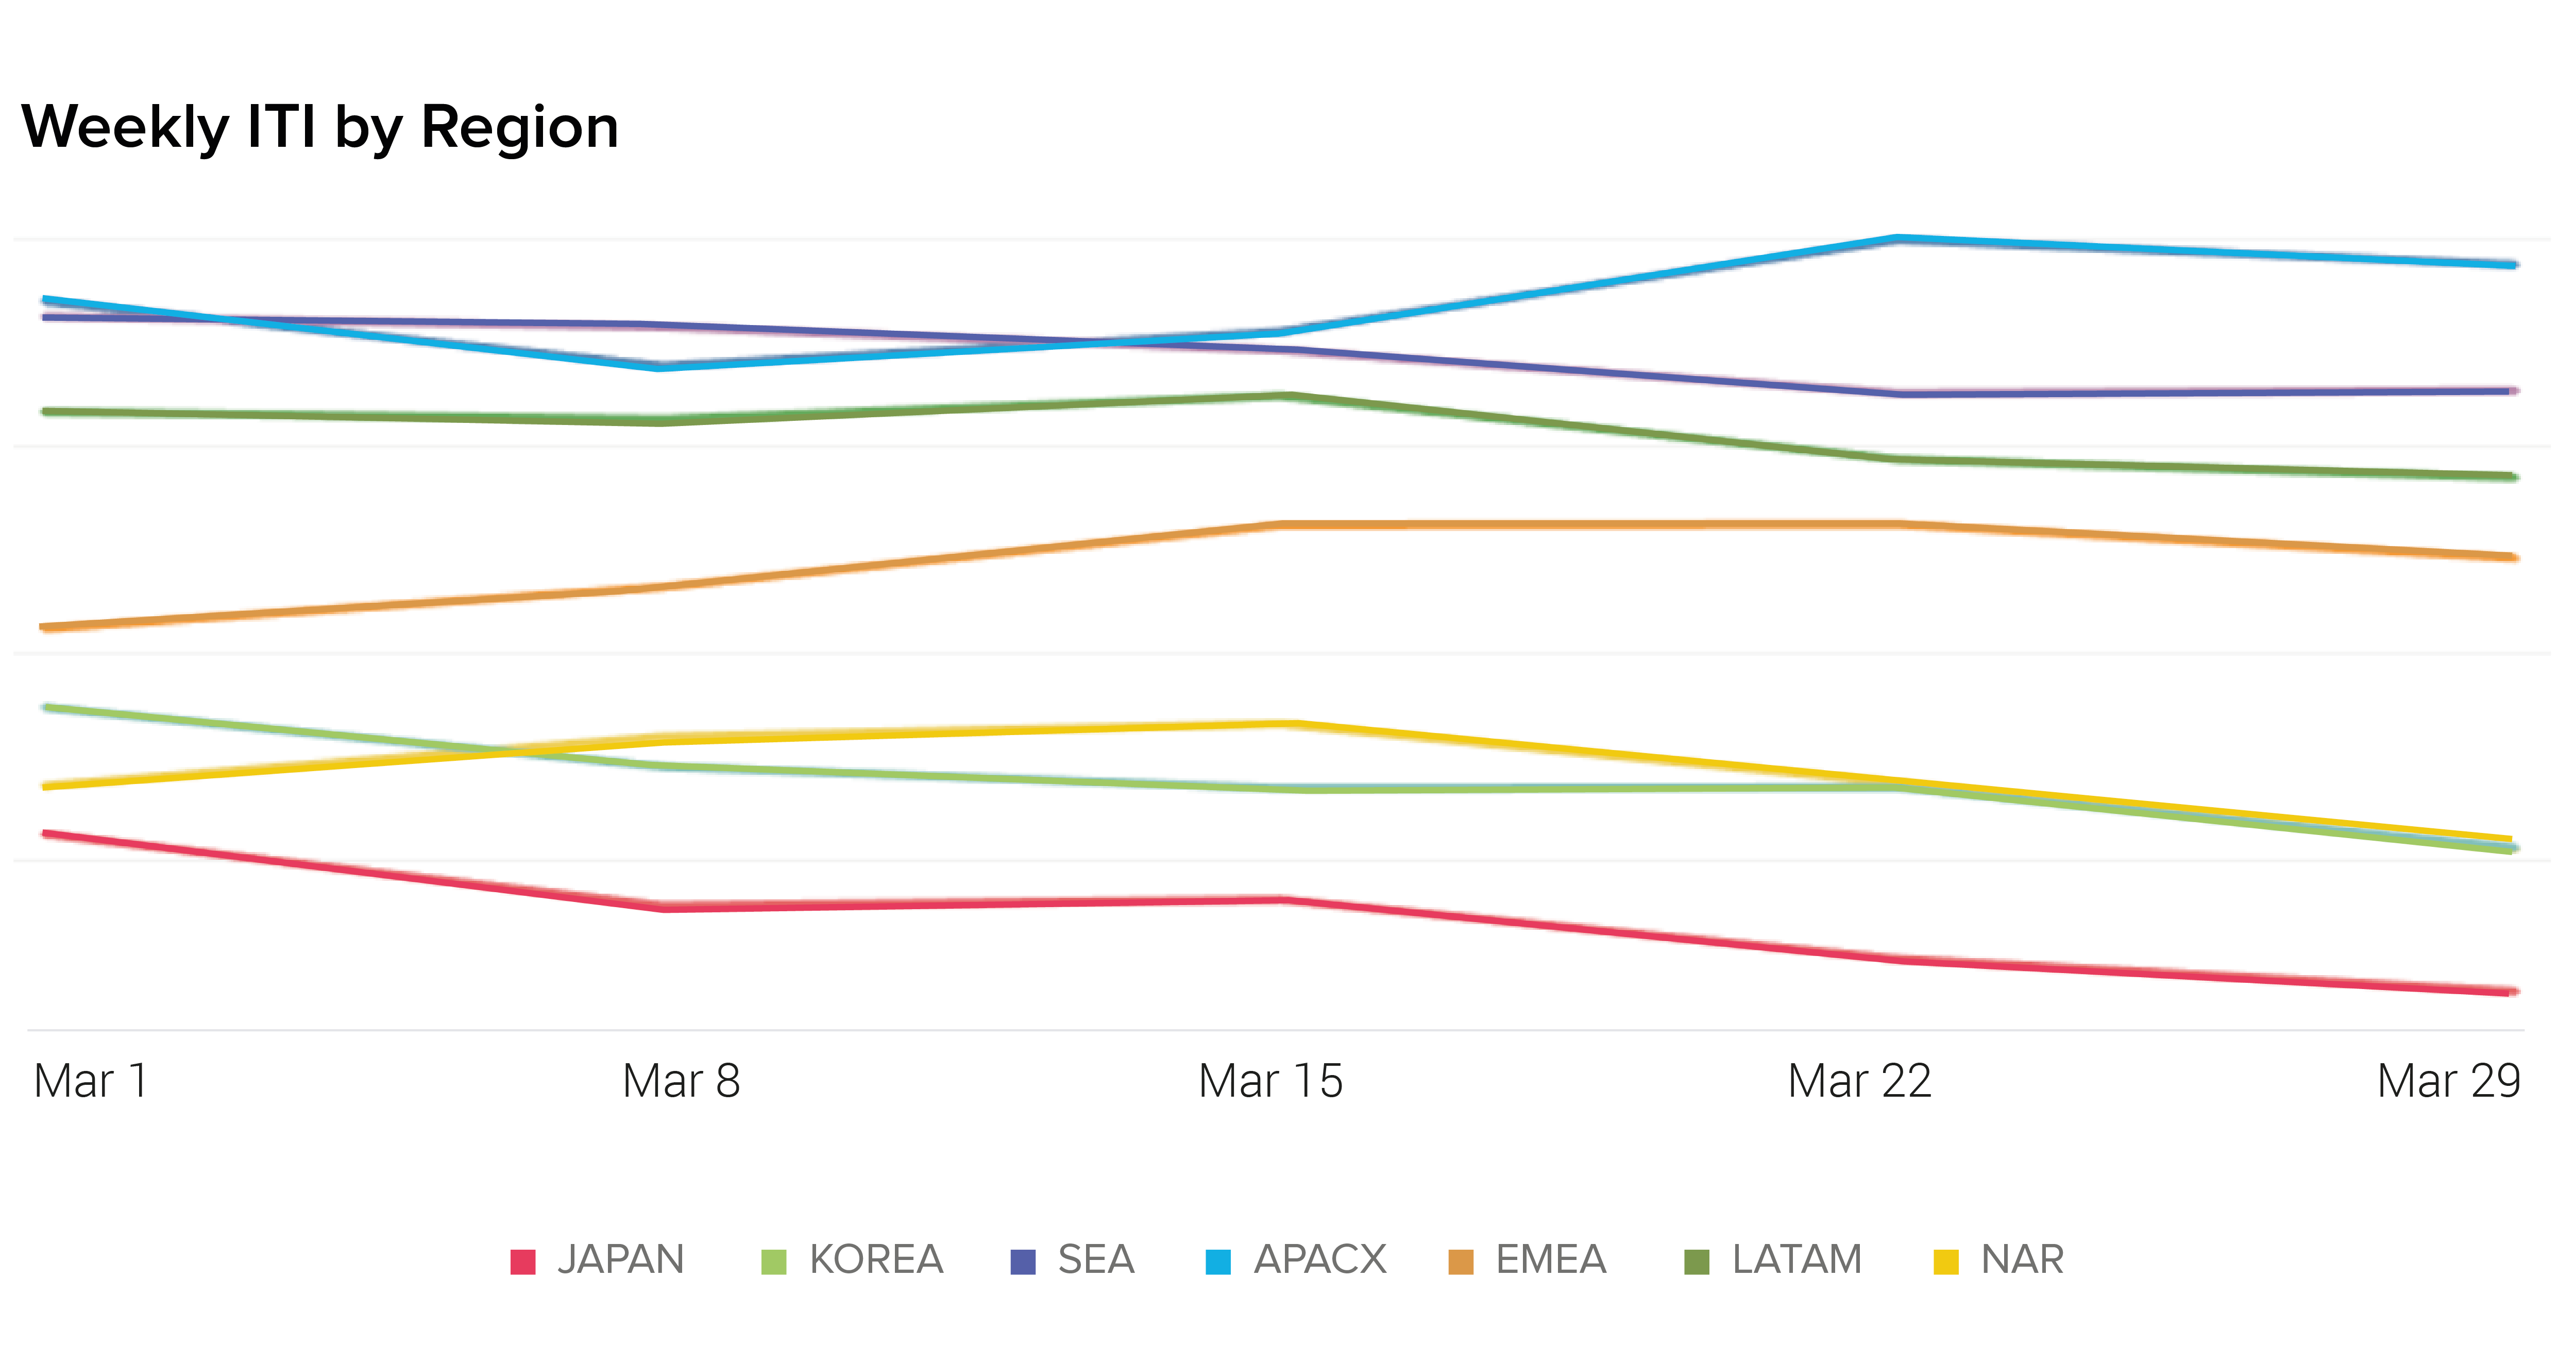
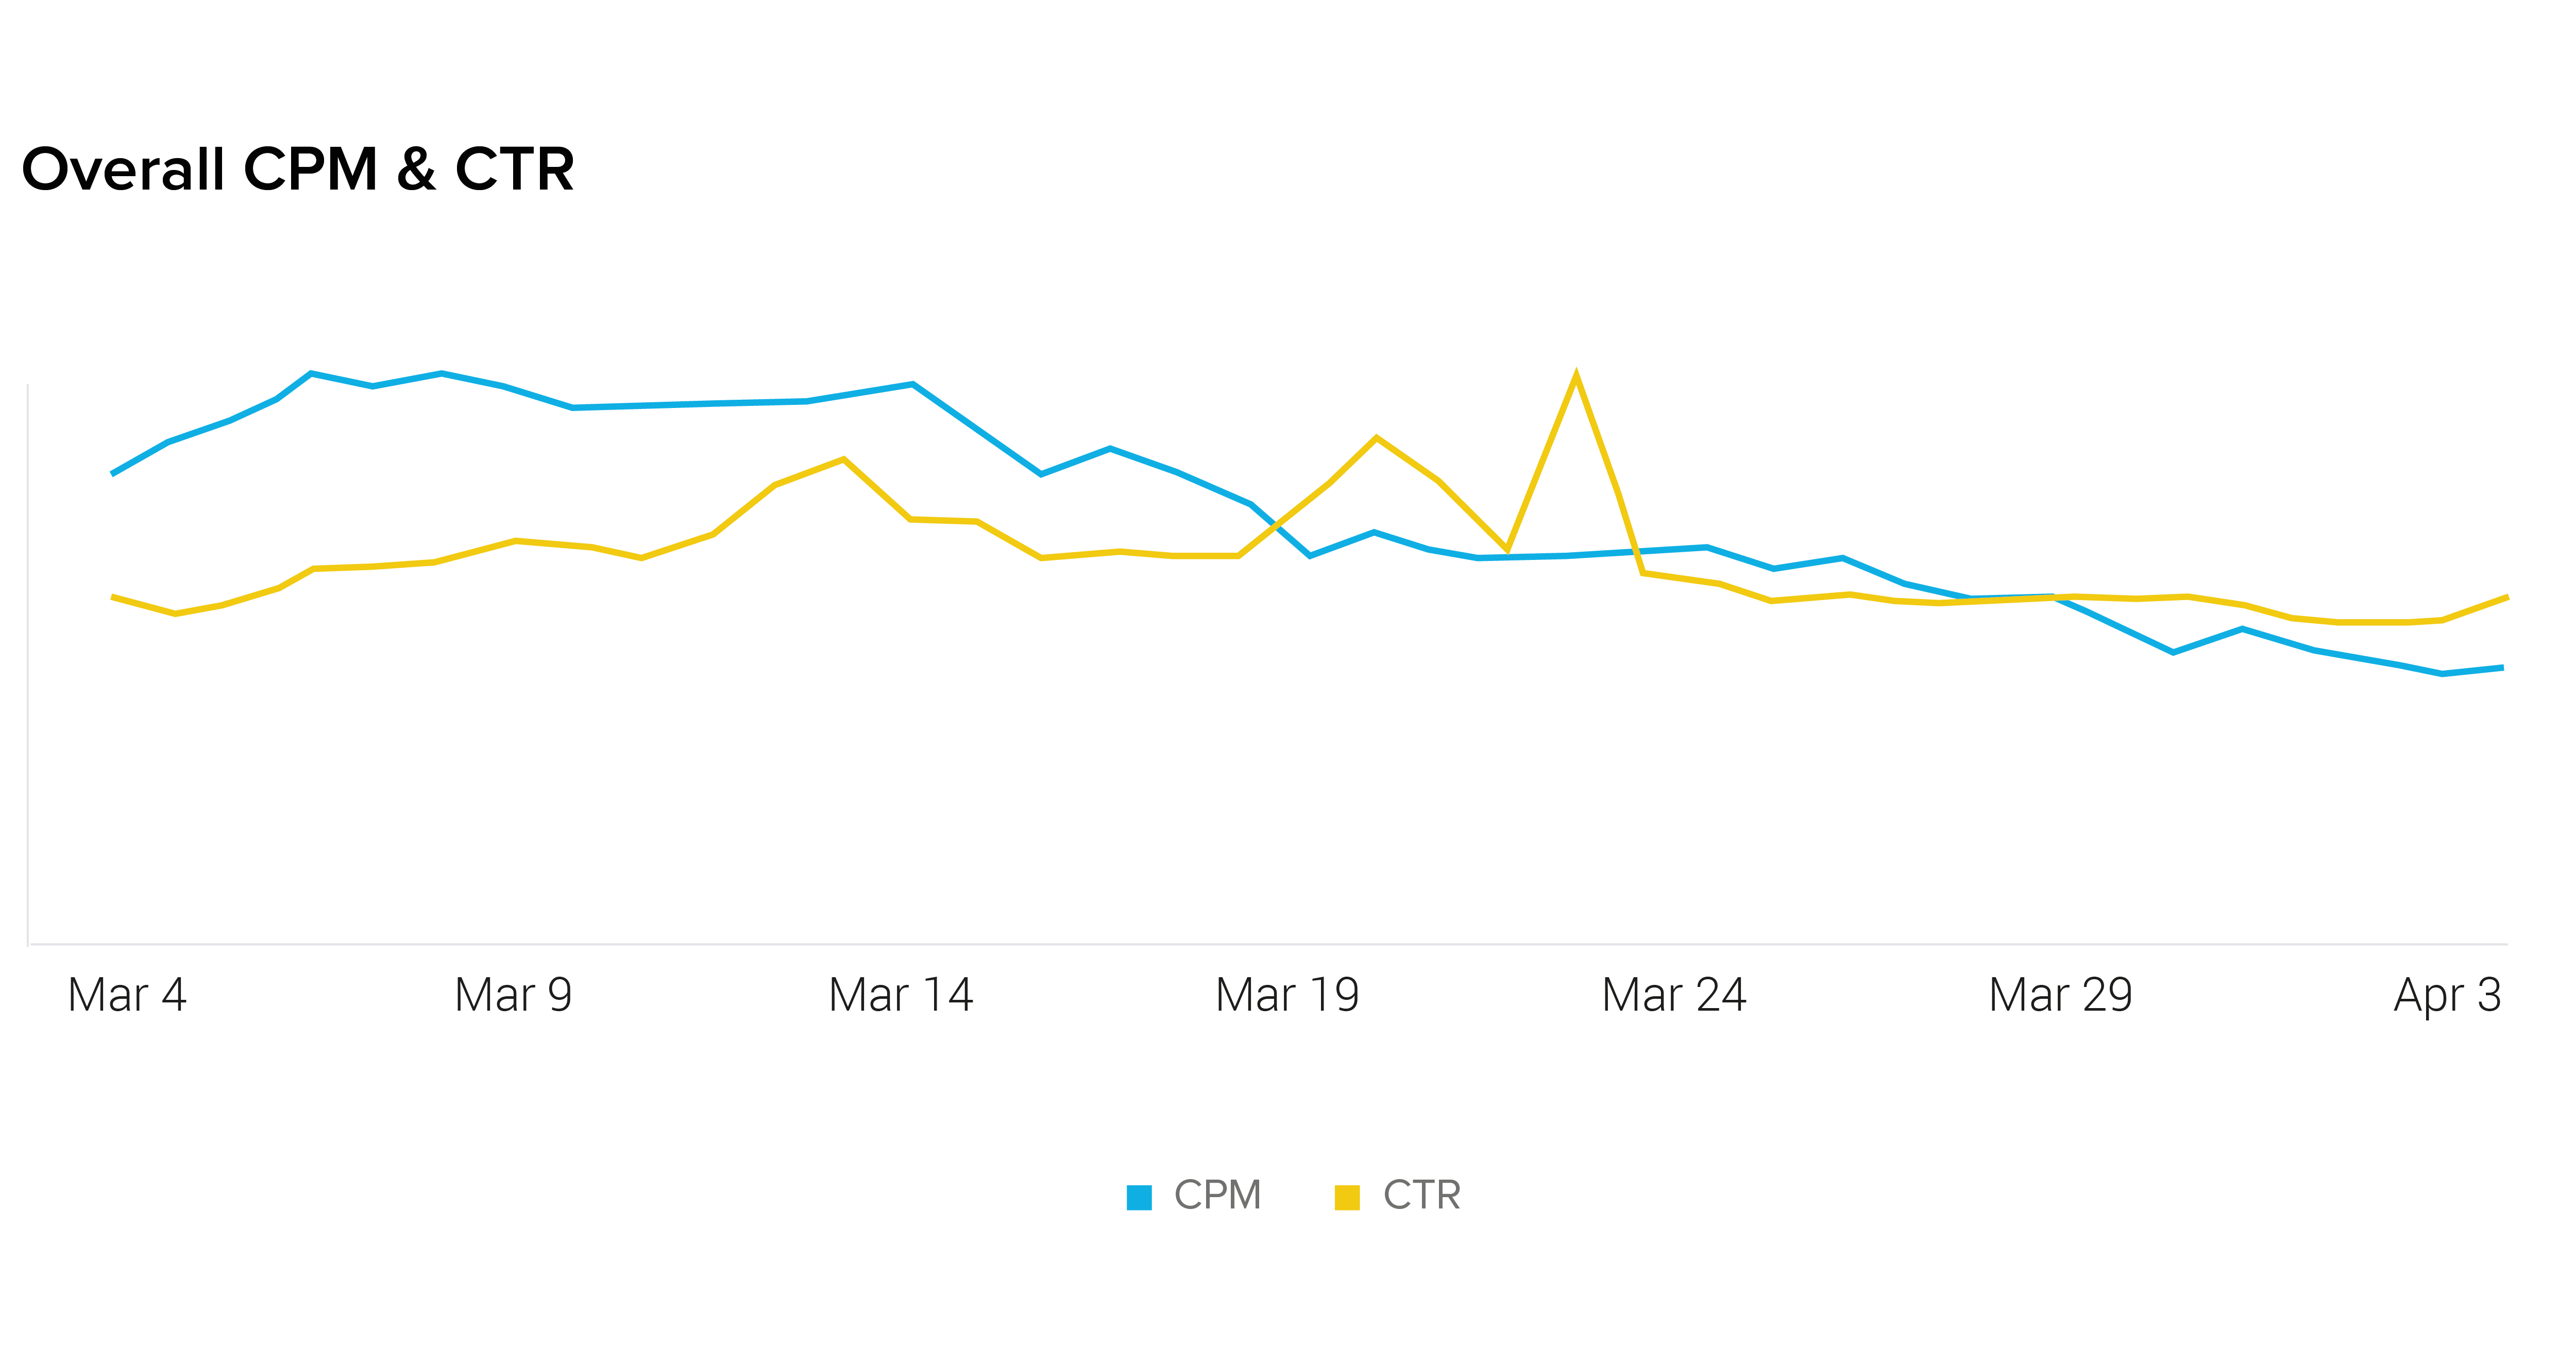
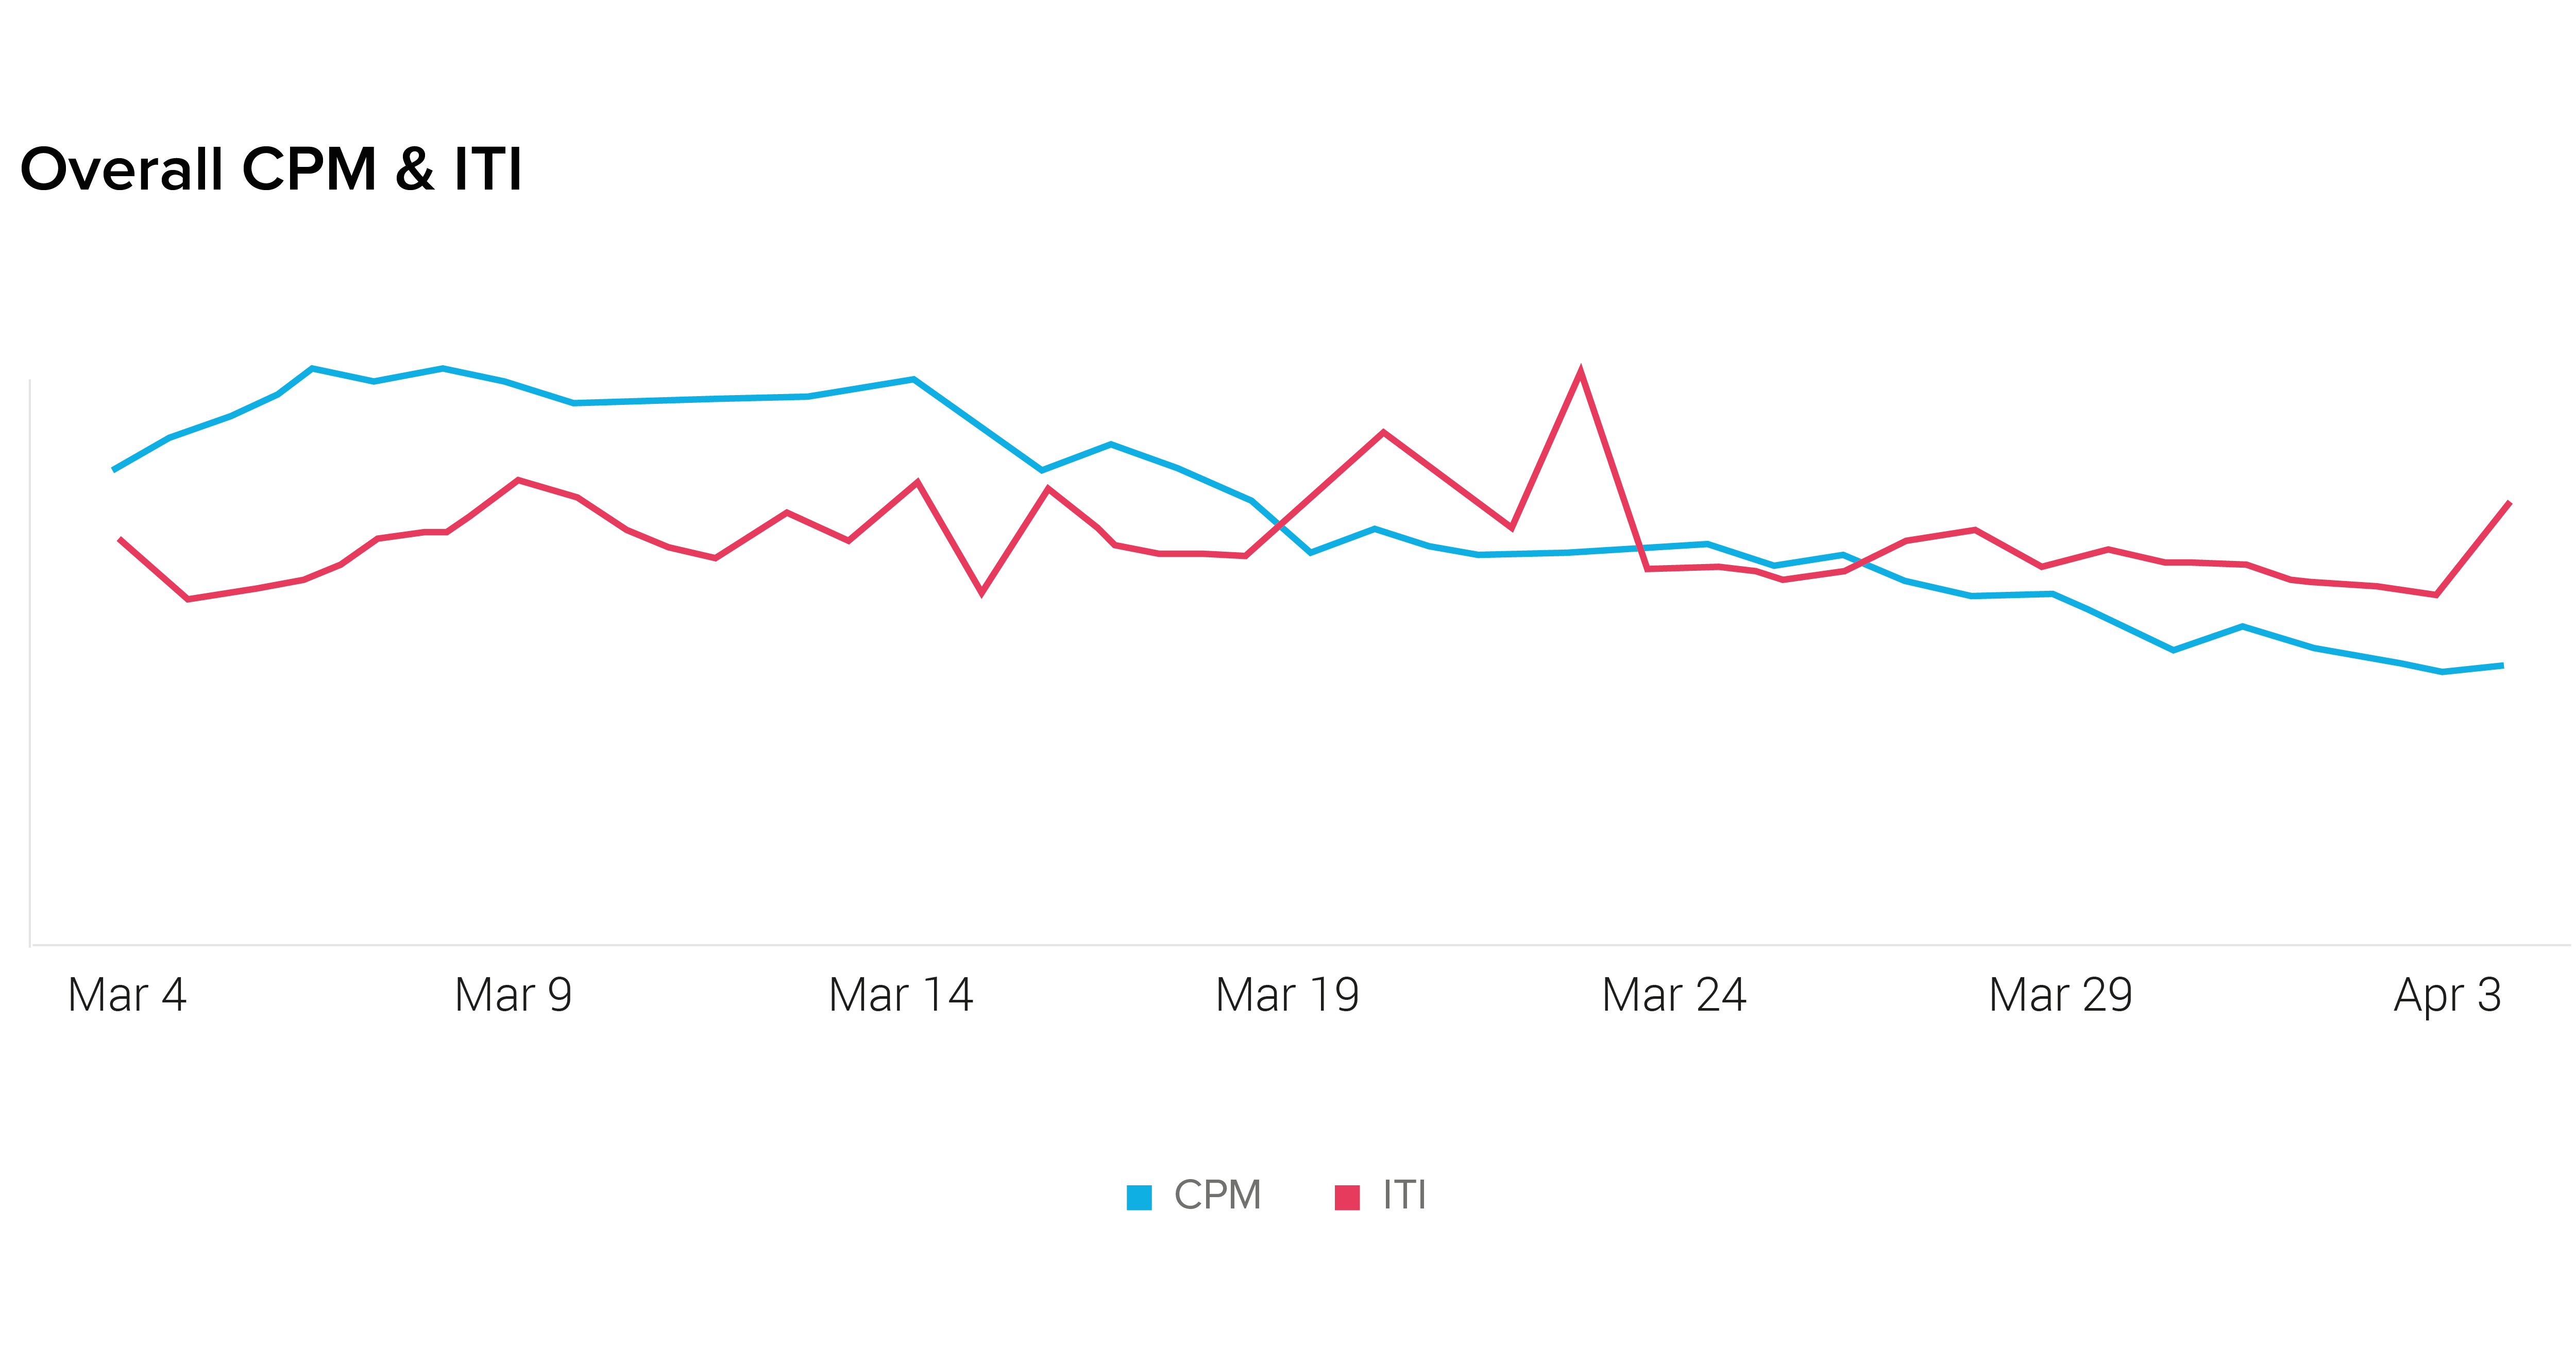
MAPT will track weekly changes across several key mobile ad performance KPIs including the cost of programmatic ad inventory (CPMs), average click-thru rate (CTR) on mobile ads, average ad impression-to-install rate (ITI) and the average cost-per-install (CPI). Make sure to bookmark this page and check back weekly for the most up-to-date information.
We hope Liftoff can be a helpful source of information for you while we all navigate the current situation.
Here are this week’s main takeaways:
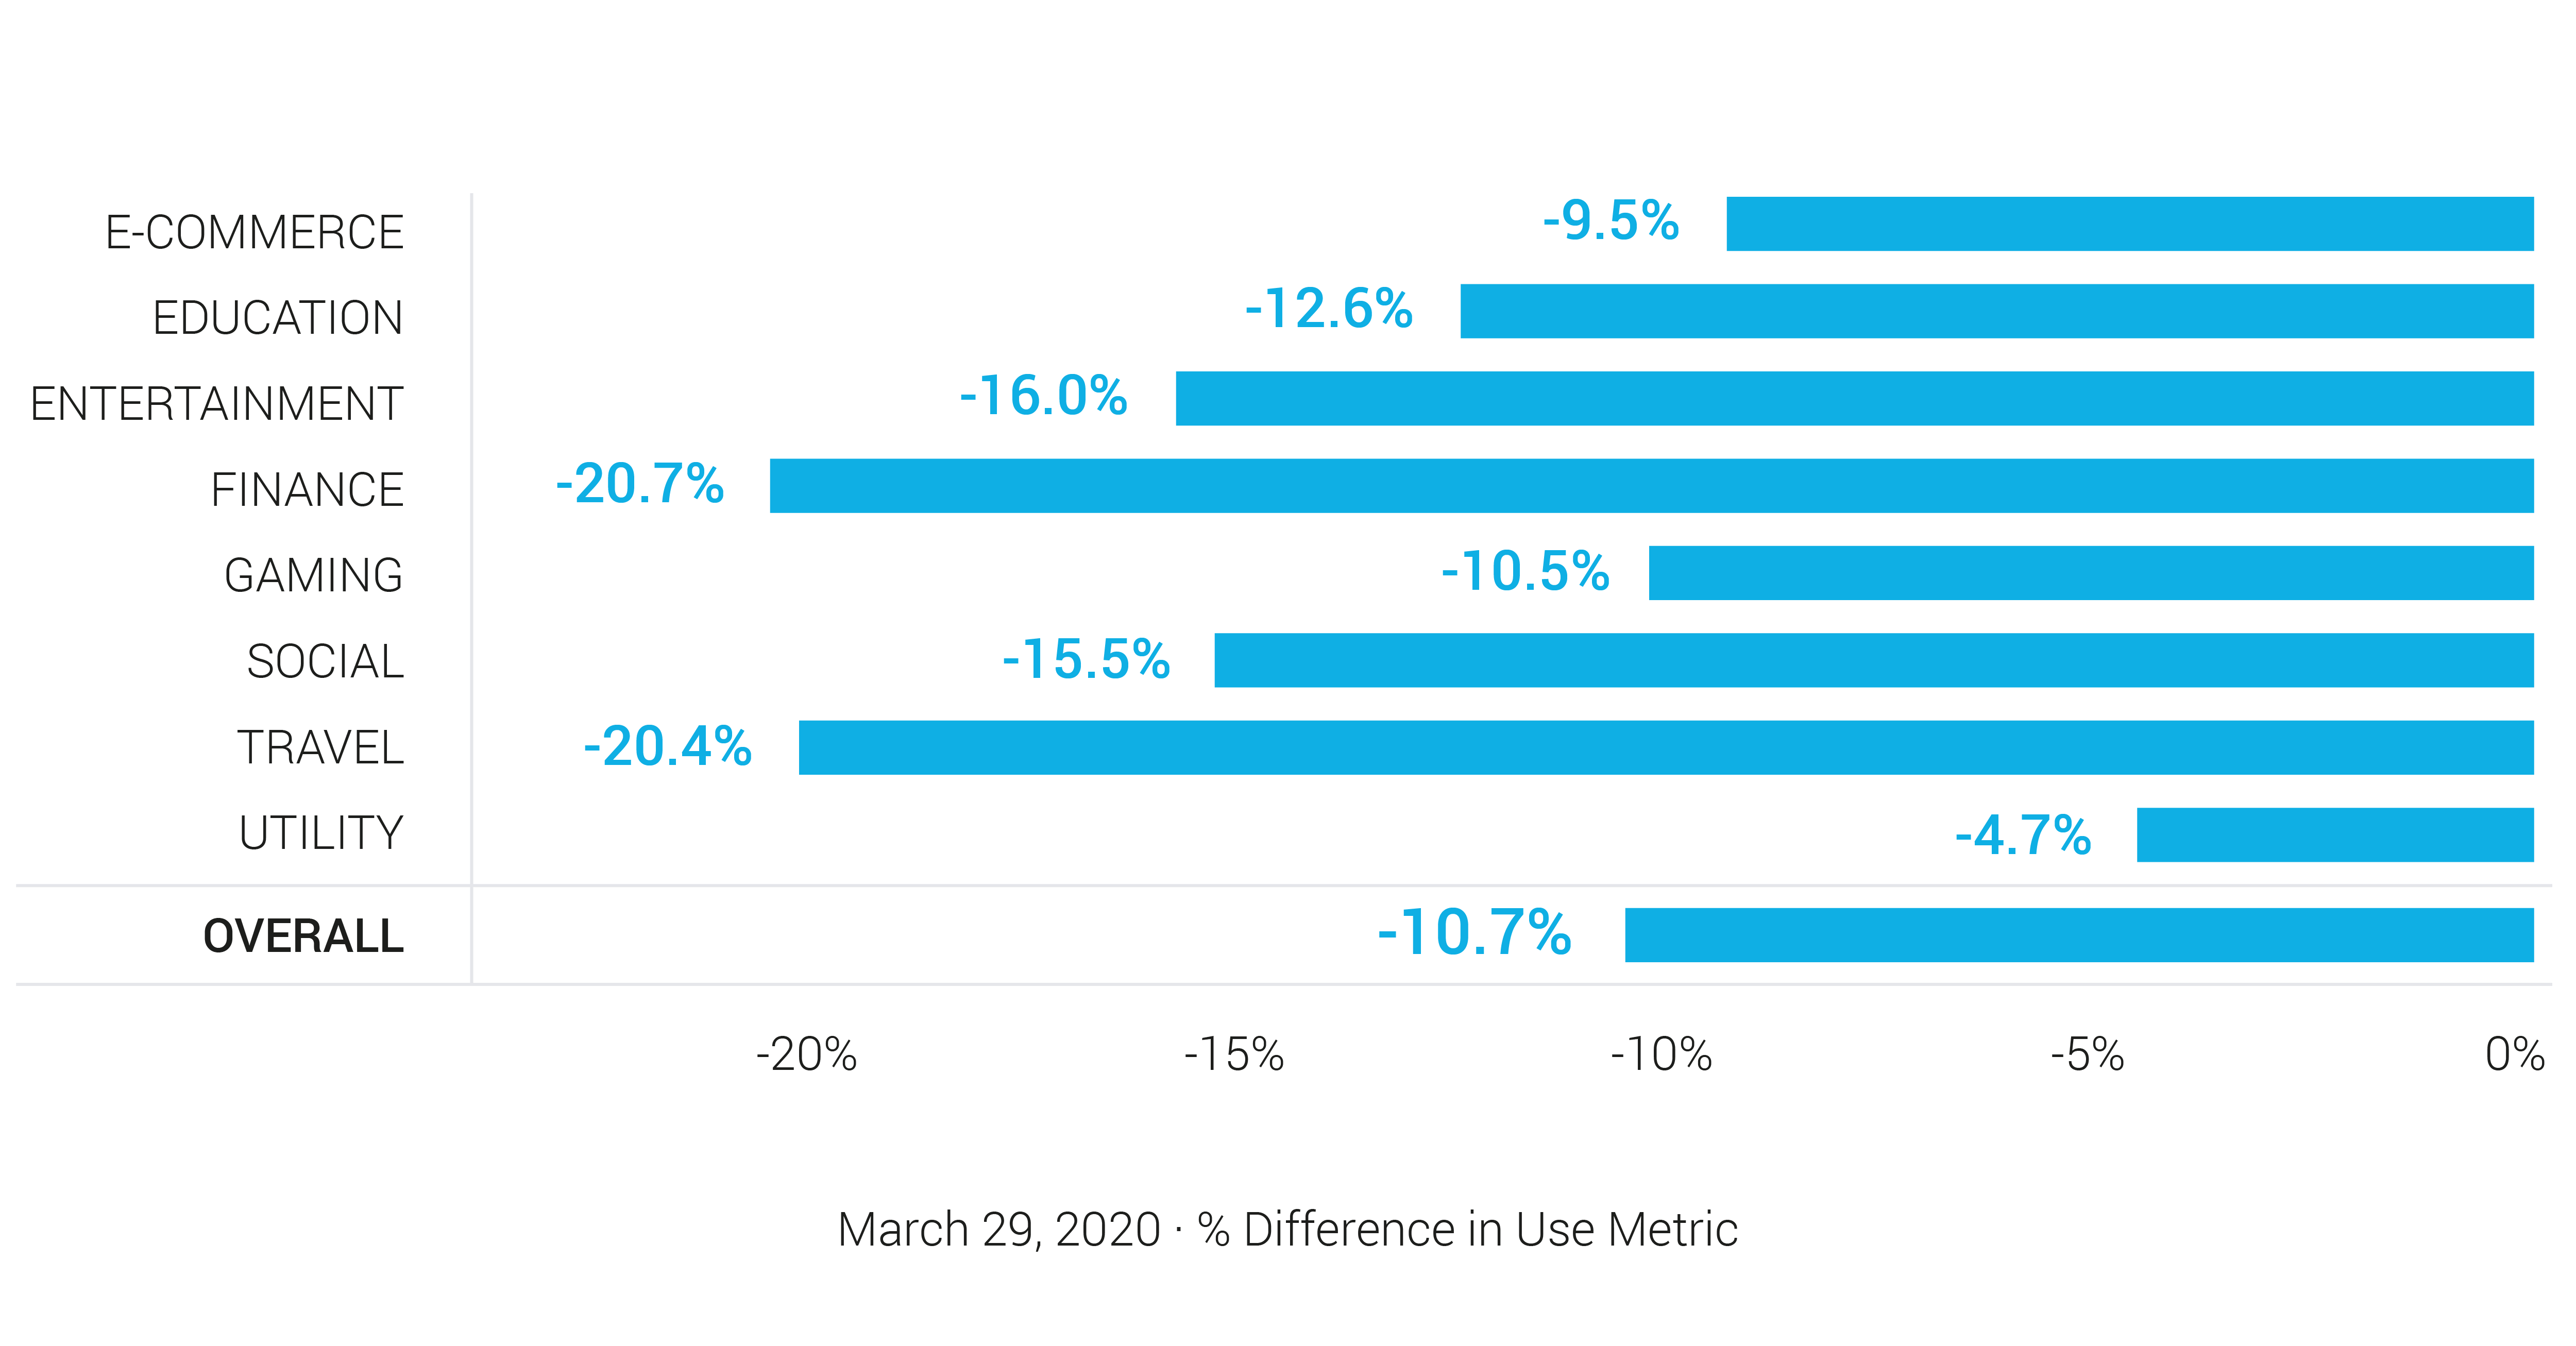
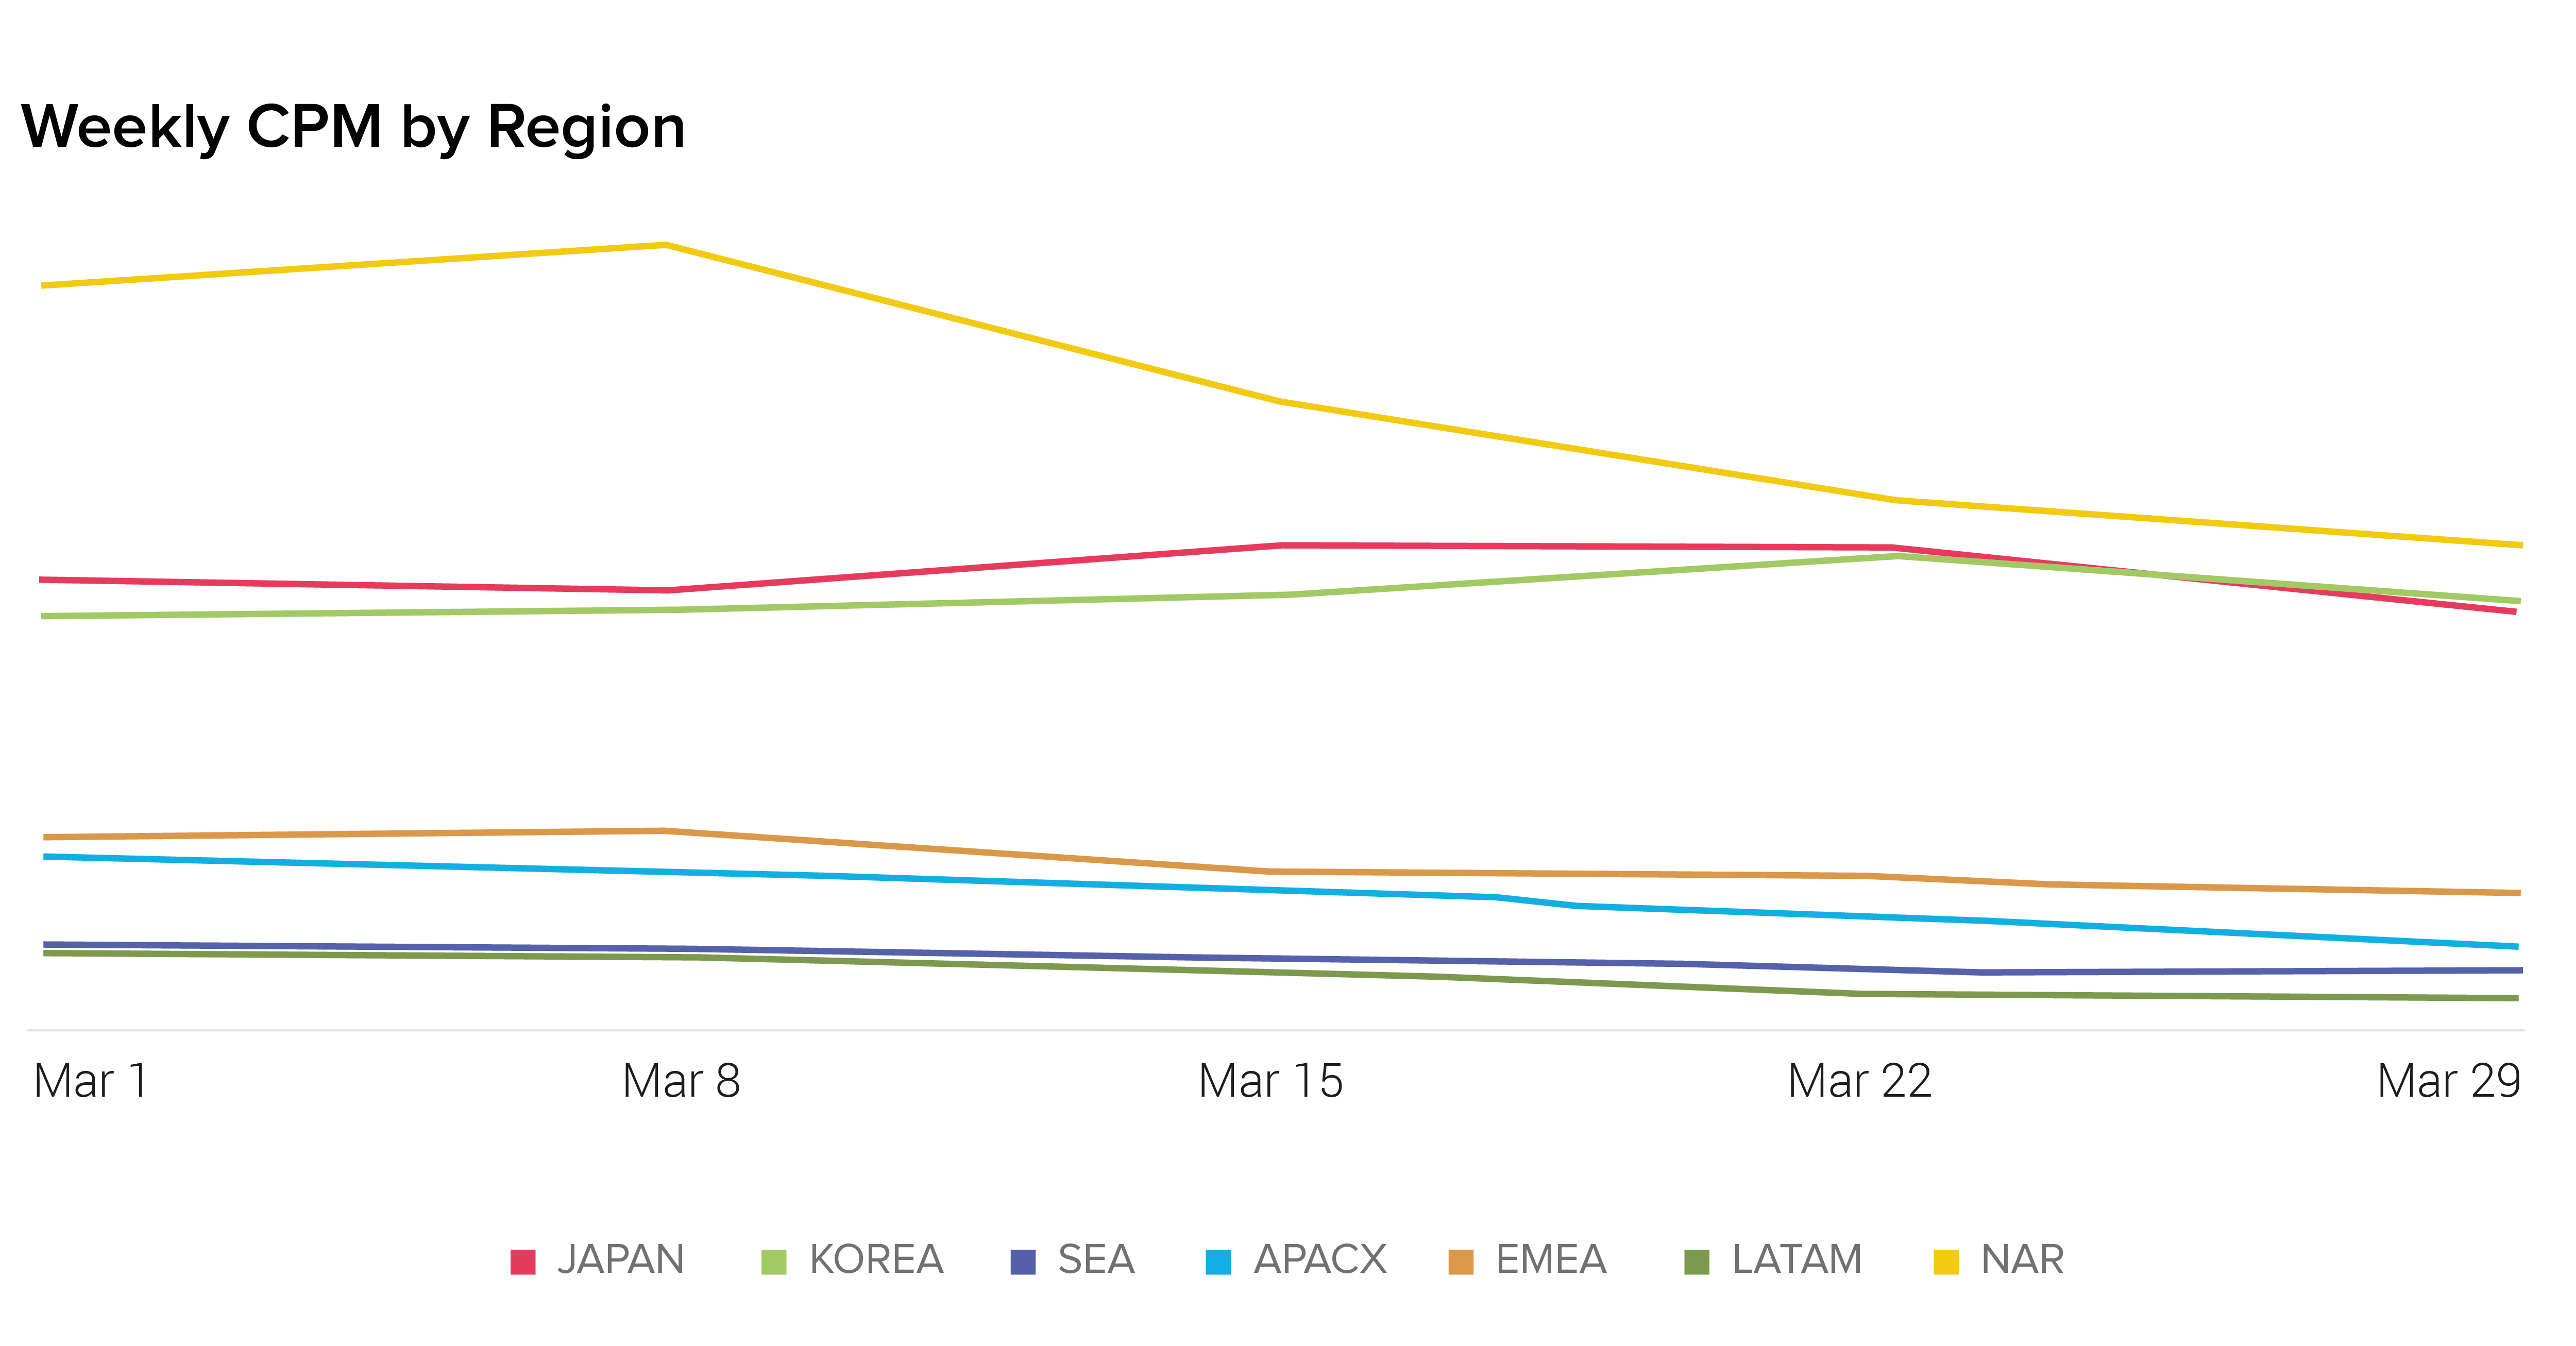
- Global CPMs continue to decrease
- CPMs decreased by 10.7% compared to the week of March 30
- CPMs are down across every region
- Global CPIs are also on the decline
- CPIs decreased by 6.8% globally compared to the week of March 30
- All regions except for North America saw a decrease in CPI
- Most regions saw subtle increases in available bid requests (BR) but they have increased for a third straight week overall
- Latin America was the only region which saw a small decrease in BRs this week
- This positive trend in available supply is likely why CPM costs have continued to decrease
- Higher bid request volume likely has two causes:
- People are using their phones more frequently
- Ad networks are pulling budget, leaving more open to programmatic
Daily View
Weekly View