Data Visualization: Where Do Gaming Installs Come From?
More than ever, app marketers are struggling to meet their audience where they are. Find out which gaming genres and sub-genres are driving installs for your gaming app with our new tool.

For mobile advertisers, finding where your installs come from is the first step to improving user acquisition. Pre-ATT, mobile marketers could take attribution for granted. But the industry has changed, and data from cross-app tracking is now remarkably limited. In 2022, only about 20% of users opted into IDFA.
So what do gaming audiences look like? Or, more importantly—what does the audience for your app look like? As part of our deep dive into gaming in the 2023 Casual Gaming Apps Report, we closely examine the ad placements driving installs. Liftoff’s tool provides a snapshot of where gaming installs come from across different categories, genres and sub-genres.
Click on the category, genre or sub-genre levels to see how installs for each level break down.
Our Methodology
Our visualization provides an aggregate view of the sources of installs across several gaming categories, genres and subgenres. The tool combines paid install data on Accelerate, Liftoff’s programmatic platform, between February 2022 to February 2023 with GameRefinery‘s industry-leading gaming taxonomy.
Analysis: What trends are we seeing across each level?
GameRefinery taxonomy breaks down mobile games into four categories: casual, casino, mid-core, and sports & driving. Each category divides mobile games into different genres and more granular sub-genres.

On a category level, we found that casual games are the primary driver of installs across the board. This is unsurprising, given that casual games appeal to a wide demographic and dominate the mobile market. That said, they also cover a wide spectrum of games, and marketers across all categories would benefit from looking more granularly at the casual games driving users to them.
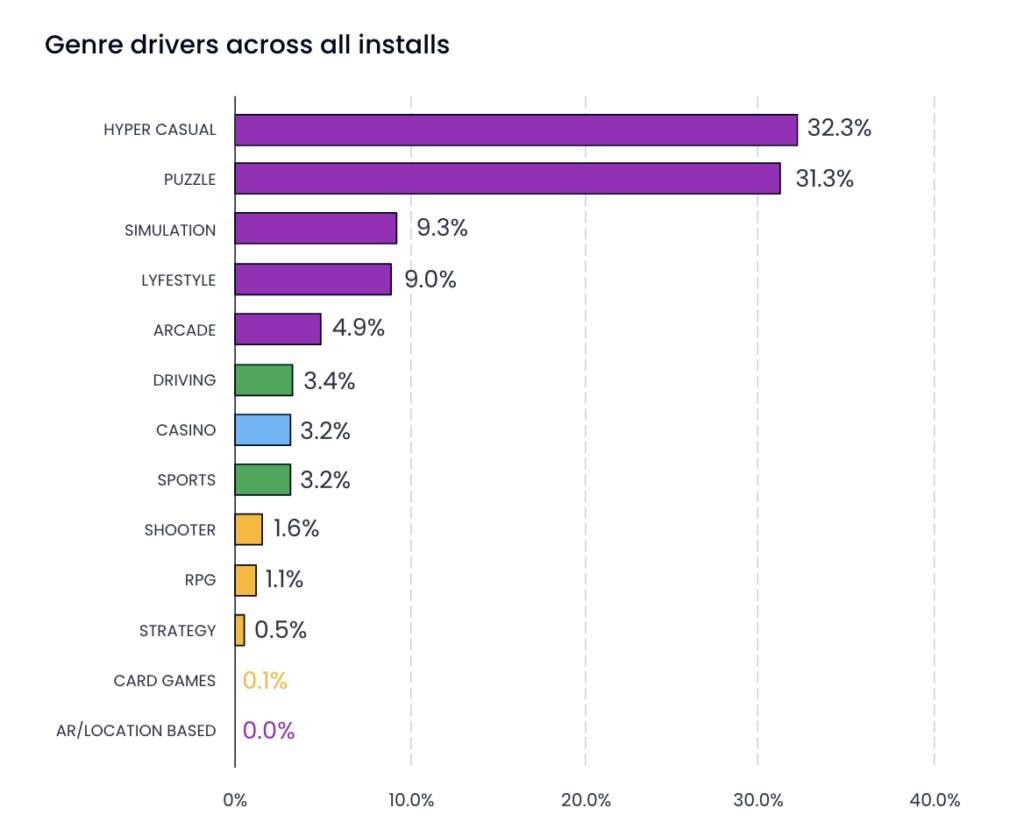
Breaking install drivers down by genre, we can see that casual game genres (in purple) are the top drivers by a significant margin. As hyper casual games, they are still a significant source of installs across all genres at 32.3%.
Puzzle games are a similarly impactful driver at 31.3%, and simulation and lifestyle games form the next tier, each driving around 9% of total installs. Mid-core genres such as strategy and card games tend to be more niche in their interests and make a smaller contribution across genres.

While we expect installs to come from games in the same genre, cross-genre drivers are a considerable source of new users. For example, simulation games only sourced 16% of installs from other simulation games.
Puzzlers and hyper casual players were both significant install drivers for simulation games. To maximize their reach, advertisers need to tap into elements that appeal to various genres and not just some of their potential audience. Simulation game developers, for example, can scale by identifying which elements in their gaming creative appeal to other casual gamers and targeting their audience accordingly.

Tycoon/crafting games, for example, cut across multiple subgenres and genres. Unsurprisingly, hyper casual games make up around 50% of installs—but word, coloring, and customization games also represent substantial sources of new users.
Regardless of what type of game you’re attempting to scale, one thing is clear. Your ads need to appeal to what motivates players to try the game. One way to do this is by highlighting the features of your app that speak to different categories, genres and subgenres that drive your installs—this will help you target players on a larger scale.
For further analysis, the latest trends in casual gaming, and a breakdown of cost and revenue benchmarks, download Liftoff’s 2023 Casual Gaming Apps Report.