
The Future of UA: Budget Allocation and Marginal Revenue
In “The Future of UA” series for the Vungle blog, we unpack key trends or issues confronting mobile marketers in the ever-evolving mobile industry. Part 4 in the series: budget allocation and marginal revenue.
In the previous article in this series, “The Future of UA: Attribution and Its Ongoing Disruption,” we emphasized how important budget allocation is in optimizing mobile marketing effectiveness.
In fact, budget allocation may be the most important initiative in the entire function of mobile marketing because it has a real cost to a business and is the most used marketing effort to grow revenue.
Allocating incremental spend to the optimal channels is a cornerstone of highly effective user acquisition (UA) teams, even though most teams today analyze and manually solve this problem.
In our latest in “The Future of UA” series, we’ll walk through a specific component of budget allocation that’s not often discussed in mobile marketing teams — marginal revenue. We’ll lay out how challenging marginal revenue is for marketing teams to conceive of and optimize for with a manual approach.
Marginal revenue and the 2-channel budget problem
One of the hardest concepts for most mobile marketers to grasp concerning budget allocation is the idea of marginal revenue.
The marginal revenue concept explains the optimal solution to a problem where adding incremental spend to an ad network or campaign as part of a portfolio of ad networks or campaigns results in varying levels of incremental, downstream in-app revenue.
Marginal revenue addresses the problem: Where should a UA manager allocate their budget to get maximum returns?
This problem exists at the platform, ad network, campaign, and publisher level.
To show how important this concept is, we’re going to demonstrate an example and analyze marginal revenue at the ad network level.
Mega App — an example
To make things easier to understand in this example, we’re going to simplify the portfolio of ad networks to just two ad networks — Ad Network A and Ad Network B. Both have a daily budget allocation that each Ad Network is spending to the budget cap (the current budget allocation isn’t relevant for this example).
The CMO of app company Mega App gives their UA manager an additional $10 budget to spend promoting Mega App, an app of the same name as the company. The UA manager needs to determine which ad network to allocate the budget toward.
We’re going to show how a UA manager can optimally do this.
Below in Chart 1, are the ROAS curves for Ad Network A and B. Each ROAS curve reflects the predicted, incremental in-app revenue generated by each Ad Network based on the additional spend/budget allocated to each.
For this example, the current D180 ROAS of each Ad Network is:
- Ad Network A: 100%
- Ad Network B: 120%
We’ve also shown the underlying data in Table 1 below. Most UA managers don’t have this type of predictive analytics at their disposal, leaving them to guess what the ROAS curve might look like. With a powerful LTV model and ad network performance modeling, however, we can model these ROAS curves.
Also Read: The Future of UA: Where Does LTV Modeling Go From Here?
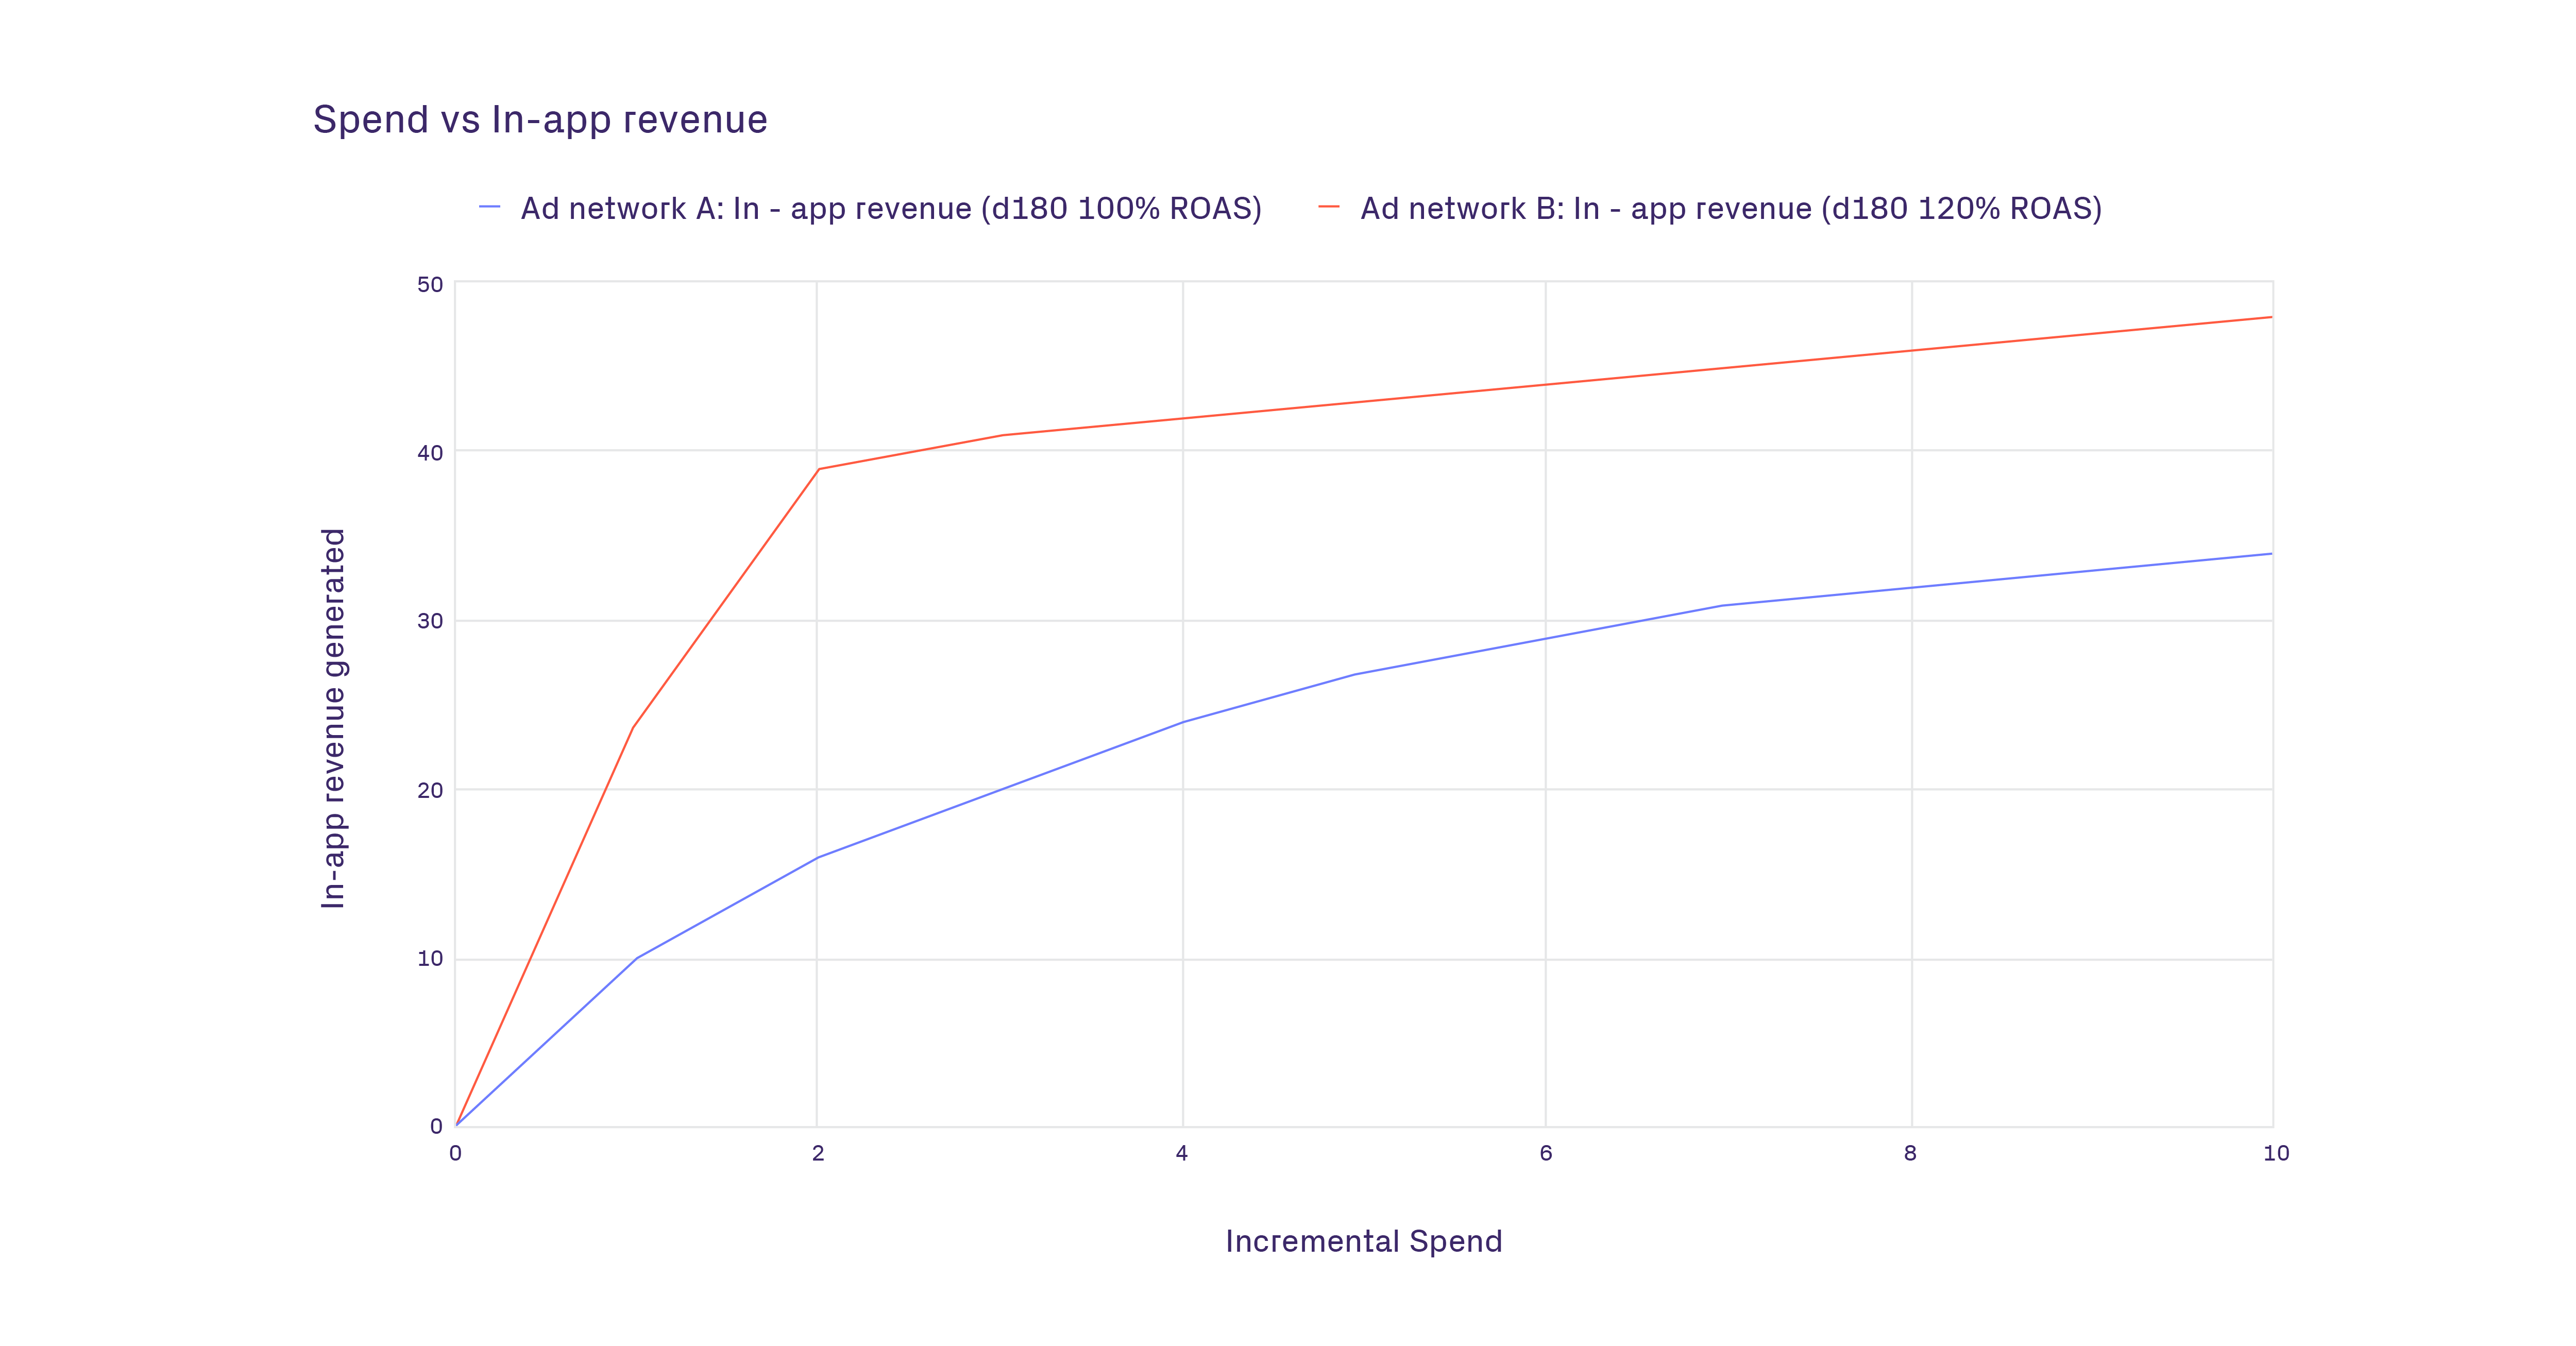 Chart 1: Example ROAS curves showing incremental spend and the related incremental revenue on Ad Network A and B
Table 1: Incremental spend and the associated in-app revenue
The UA manager wants to know how to allocate $10 of spend between the two channels to achieve the maximum total revenue.
The answer isn’t intuitive, and the UA manager might think they should give all the budget to Ad Network B because the predicted ROAS is higher (120% versus 100%). The answer, however, is to spend on each channel until the point where the marginal revenue of both channels is the same. In other words, the UA manager achieves a spend level on each Ad Network until an additional dollar spent on each generates the same additional revenue.
The math explained
Achieving a spend level at which each Ad Network returns the same additional revenue is a hard concept to grasp. We can, however, dissect this problem by simply allocating an incremental $1 at a time to the channel that generates the most revenue for that additional $1.
Let’s trial this by adding dollar by dollar while referring to the above table:
1. Spend an incremental $1 on Ad Network
- A. Spend on A and get additional revenue $10 – $0 = $10
- B. Or spend on B and get additional revenue $24 – $0 = $24
$24 > $10 so the first dollar goes to B
2. Spend an incremental $2 on Ad Network
- A. Spend on A and get additional revenue $16 – $10 = $6
- B. Or spend on B and get additional revenue $39 – $24 = $15
$15 > $6 so the second dollar goes to B
3. Spend an incremental $3 on Ad Network
- A. Spend on A and get additional revenue $20 – $16 = $4
- B. Or spend on B and get additional revenue $41 – $39 = $2
$4 > $2 so the third dollar goes to A
4. Spend an incremental $4 on Ad Network
- A. Spend on A and get additional revenue $24 – $20 = $4
- B. Or spend on B and get additional revenue $42 – $41 = $1
$4 > $1 so the fourth dollar goes to A
5. Repeat the same process for the remaining dollars of the budget.
Eventually, this example shows that it’s not optimal to spend the entire budget on Ad Network B, even though B shows higher revenue than A. If we spend $10 on B, our total revenue is $48.
The optimal solution is for the UA manager to allocate $7 out of the $10 budget to Ad Network A and $3 to Ad Network B. With this spend allocation, the UA manager generates $65 in in-app revenue.
There is a high cost to misallocating the budget to the wrong Ad Network, with a marginal in-app revenue loss of $17 if the UA manager decided to allocate all the budget to Ad Network B versus the optimal solution.
Automated UA is the future
Here, we’ve provided a simple example of Mega App spending on 2 ad networks and the significant challenge they needed to overcome in determining the allocation of incremental budget.
To be able to model this problem, we need to calculate daily:
- LTV for each ad network
- The incremental spend curve for each ad network
It’s impossible for the UA manager at Mega App to be able to manually model LTV as well as the incremental spend curve for each ad network, especially if Mega App is spending on more than 2 channels. If Mega App was spending on, for example, 10 ad networks, the UA manager would need to manually solve this problem across all ad networks, modeling LTV and the incremental spend curve for each.
Also Read: How Automation Solves UA’s Biggest Problems on iOS Today
This is why the future of budget allocation at the ad network, campaign, and publisher level has to be fully automated using algorithms and with changes programmatically made on the ad networks using APIs.