Prime Day Isn’t Just For Amazon
On Monday, July 16th, for 36 hours Amazon held their 4th annual Amazon Prime Day, selling thousands of products at deeply discounted prices, and resulting once again in Amazon’s biggest sales day ever in the history of the company. And hundreds of other ecommerce businesses followed suit, turning July into the new Black Friday.
Similar to last year, we examined the impact that Prime Day had on other mobile shopping apps. Would we again see a lift in sales amongst other shopping apps? Is the effort to rebrand Prime Day as Black Friday in July having a positive impact on sales?
To better understand the impact of Prime Day on mobile shopping apps not named Amazon, Liftoff analyzed the install and purchase rates over a 7-day period, starting the Saturday before Prime Day through the following Friday. We then compared “Prime Week” to the previous 5-week period to establish benchmarks for shopping app install rates and purchase rates. While performance differed somewhat compared to last year, some clear trends emerged.
Install-To-Purchase Rates Are Up Big, New Installs Dip
Across the entire week, the percentage of users who installed a non-Amazon shopping app and made a purchase increased by 46.18% when compared to the previous 5-week period, nearly identical to what we saw last year (46.76% lift). And similar to last year, we again saw the % of new shopping app installs decrease during Prime Week by 6.42%, suggesting that while slightly fewer people installed shopping apps throughout the week, those that did, did so with a very high intent to purchase.
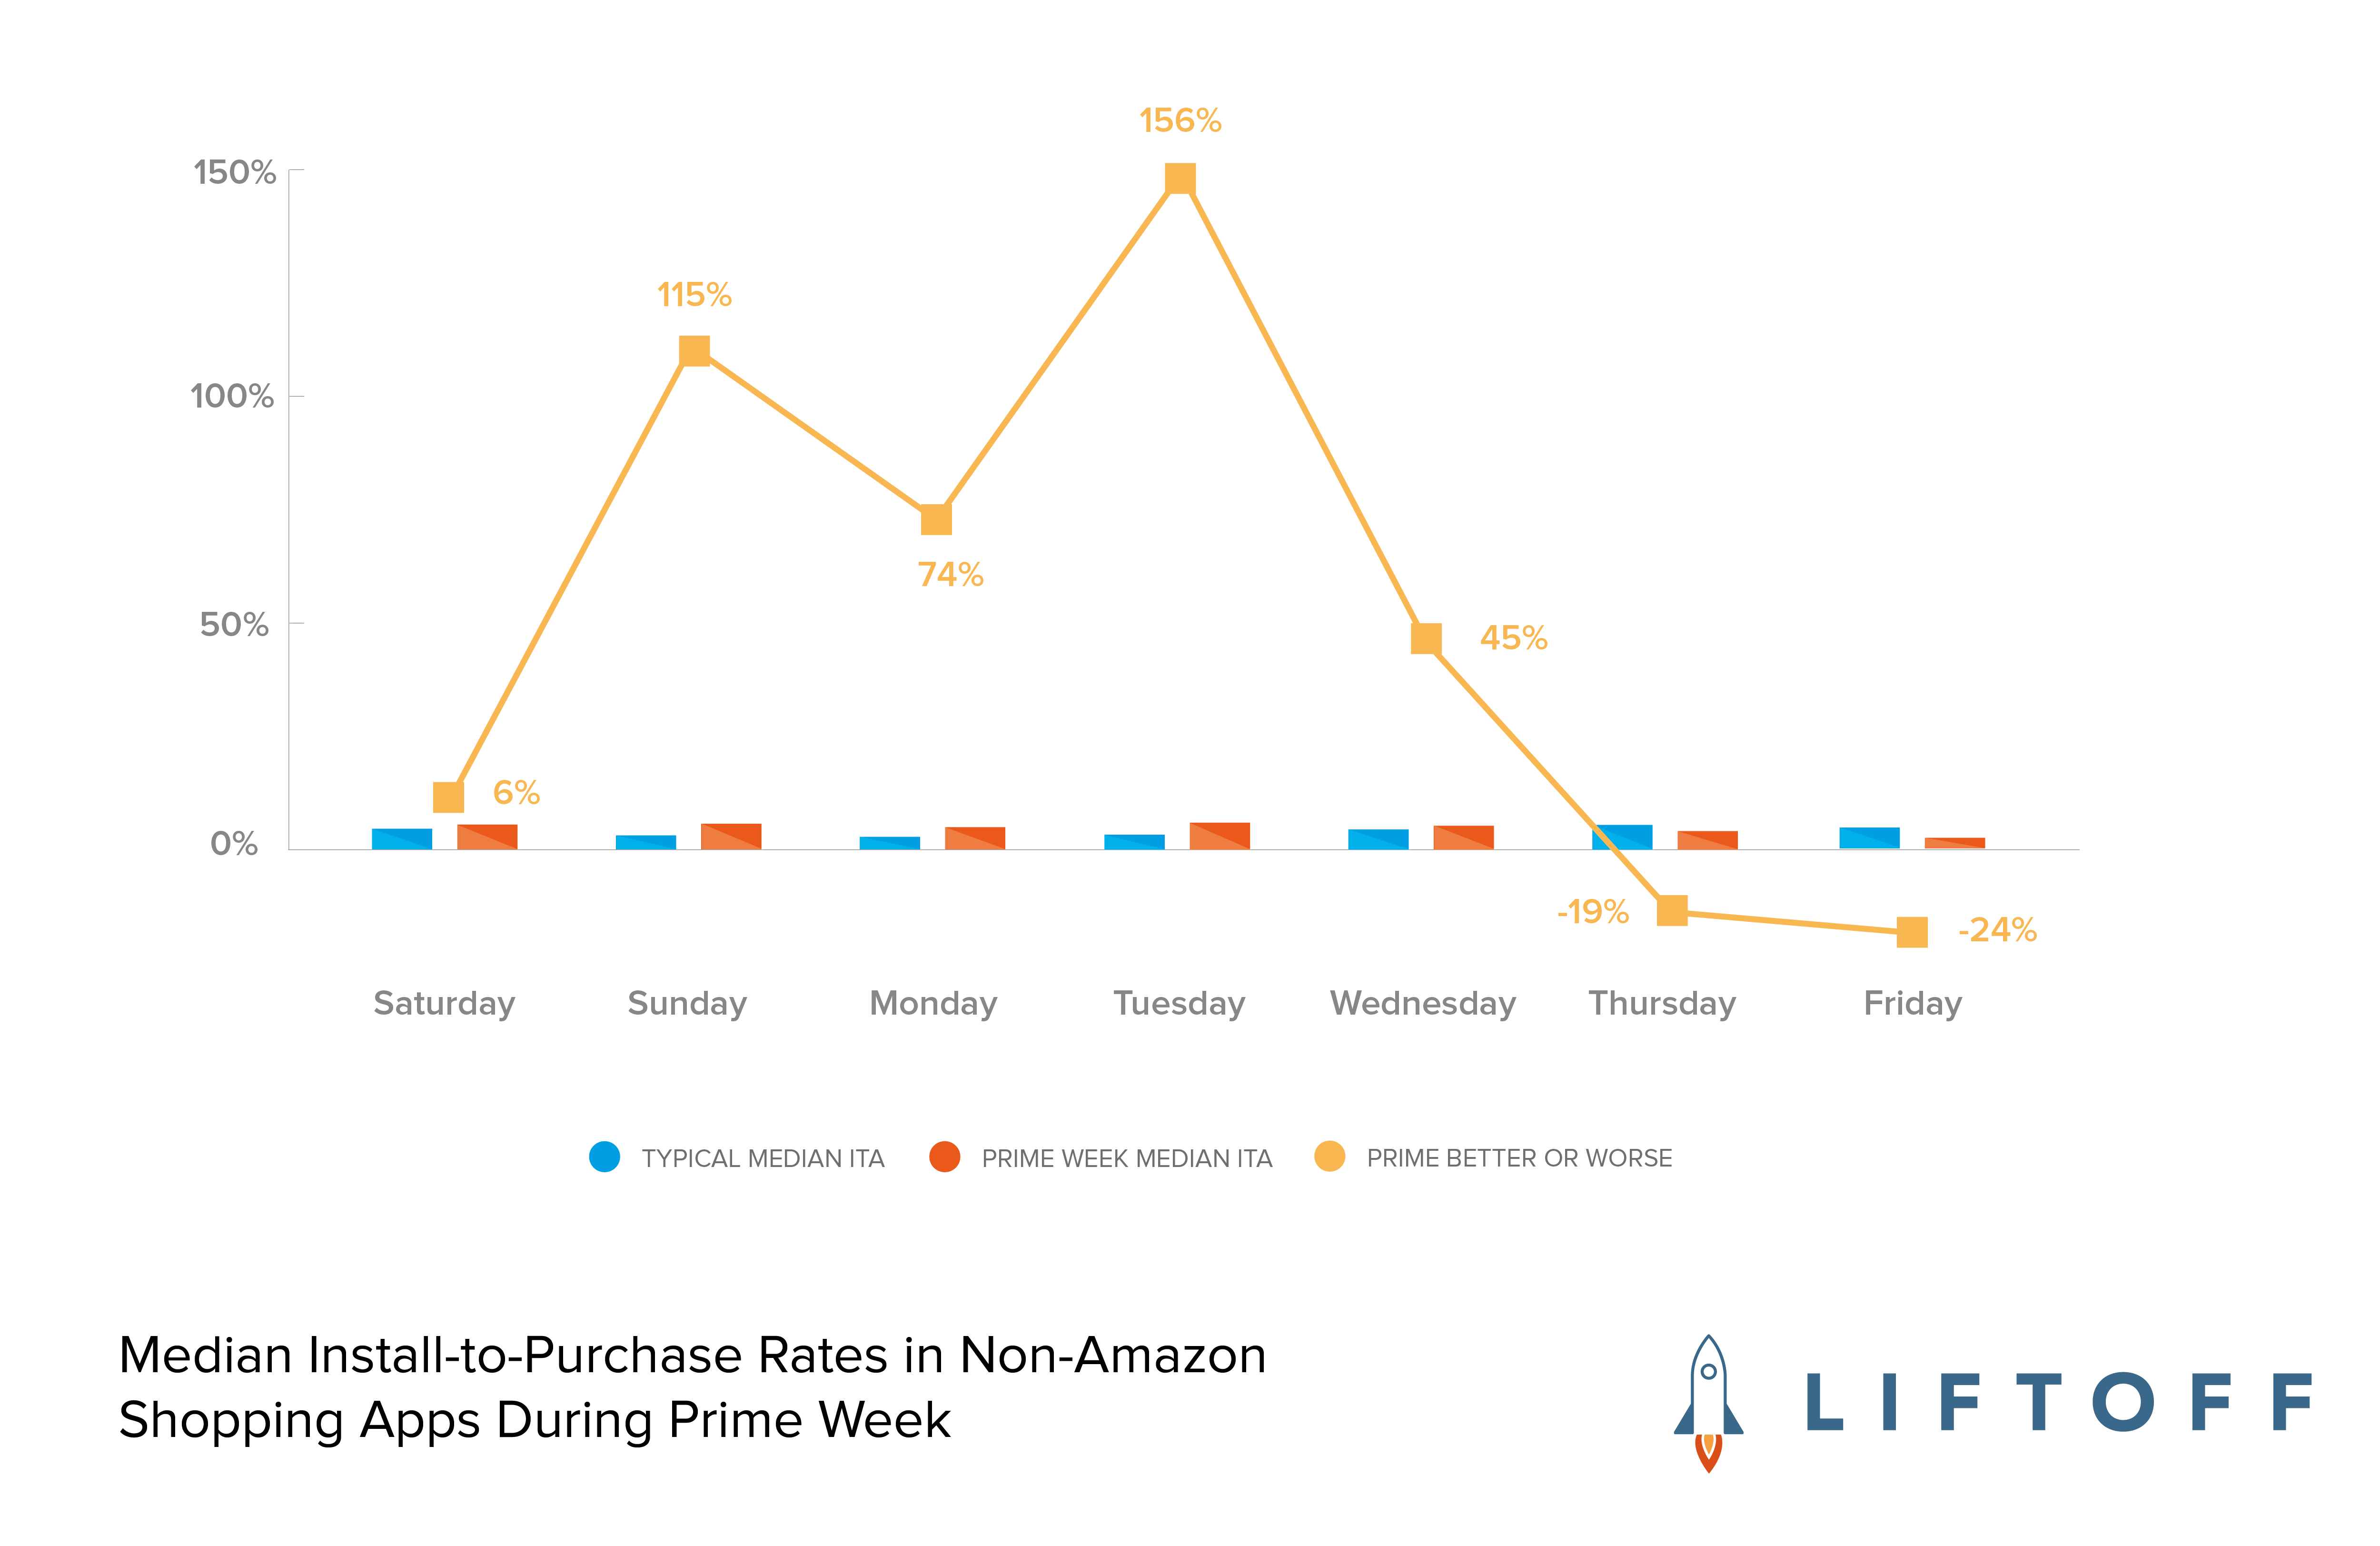
Even more interesting, when we look at a daily breakdown of the install-to-purchase rate throughout Prime Week and calculate the lift in purchases compared to the prior five weeks, we see a very distinct trend as can be seen in the chart and table below.
Prime Day Lifts Sales for All Shopping Apps

| Sat | Sun | Mon | Prime Day | Wed | Thurs | Fri | |
|---|---|---|---|---|---|---|---|
| Prime Week ITA | 4.20% | 5.98% | 5.77% | 6.91% | 5.80% | 4.88% | 3.36% |
| 5 Week Average ITA | 3.95% | 2.78% | 3.31% | 2.70% | 4.00% | 5.99% | 4.41% |
| Lift During Prime Week | 6.29% | 115.45% | 74.13% | 156.28% | 44.96% | -18.56% | -23.78% |
ITA = install to purchase
Starting one day before Prime Day kicked off, consumers installed and made purchases in non-Amazon shopping apps at a significantly higher rate when compared to the prior 5-sweek period, a lift of 115%. And unlike last year, on Prime Day itself, we continued to see a massive lift in consumers installing shopping app and making a purchase (156% lift), with the trend continuing through to the day after Prime Day (44.96% lift).
Consumer Fatigue Sets In
This year’s Prime Day event was Amazon’s longest yet, with 36 full hours of deals as opposed to the standard 24. Not only that, but with the sales kicking off on Monday, it was also the company’s earliest start. This extension of the event, the data suggests, may have taken a toll on shoppers’ staying power.
While Prime Day boosted other retail apps in advance of and during the event, the days that followed took a major hit in install-to-purchase activity, with sales plummeting to a low of negative 23.78% on Friday compared to the prior 5-week period. This is in contrast to last year, when the install-to-purchase rate saw a lift of 70.69%, the highest of the week, on the Thursday following Prime Day, before closing out the week with a lift of over 30%.
For mobile marketers this year, the days leading up to and including Prime Day delivered a huge lift to retail sales, and indicate tremendous opportunity to drive meaningful sales and revenue. To capitalize on this sales frenzy, marketers should target new users in advance of next year’s holiday and engage their attention all the way through the event.
For mobile marketers, Prime “Week” once again delivered a huge lift in mobile sales.
Note: this report is based on an analysis of over 4.1 billion mobile ad impressions, 867,520 app installs and 48,817 purchases within non-Amazon mobile shopping apps. Only countries where Prime Day was offered (17 countries total) were included in the study.