Beyond Creative Tests: How Trailmix Turned Watch Time Data Into Creative Wins
Philippa Layburn is Senior User Acquisition Manager at Trailmix. Her career began in a publishing house with a portfolio that included various apps from sports to audio. After nearly two years there, Philippa moved to King, spurred by her love of Candy Crush. She spent over three years working across their key casual titles and on the soft launch of their newer RPGs. Philippa honed her performance marketing skills, scaling many games on Google Ads and other channels. Now, Philippa is on a journey with Trailmix to make Love & Pies the biggest casual game around.
Learn more about Mobile Hero Philippa.
Creative tests are an excellent way to determine winning creatives without spending big. We all know the importance of creatives for UA. In this blog, I’ll cover what you might miss if you only look at traditional creative test metrics.
Recently at Trailmix, we found a winning video that halved the CPI of our previous winner. However, we could not beat this video for the next five months. So, what were we gaining from creative tests? Well, almost nothing. After a few months of trying many new concepts, we knew we had to change it up. So I devised a plan.
The plan was a deep dive into the creative process to determine what we could learn. I investigated as many elements of the creative process as I could:
- A/B tests: key metrics and conditions.
- BAU vs. Tests: are test winners always the best ads when launched in BAU campaigns?
- Creative: new concepts, formats and iterations.
- Other factors: audience insights, competitor analyses, etc.
This article will walk through some of my key learnings in creative testing. But it’s important to note that all the elements above are important and can impact performance.
Why ads win: looking beyond basic metrics
To determine a creative winner, we generally consider primary metrics like CPI and ITI and secondary metrics like Loyal User Rate, CTR and CTI. Although these metrics help explain ad quality, I realized that they do not tell us why an ad won—the real question I was trying to answer. This led me to pursue a whole new line of thought.
To understand why something wins, I took watch times as a metric. The first three seconds of a video are crucial in UA. You have likely caught a user’s attention if they stick with the video past the first three seconds. We hypothesized that by digging into watch time data, we can better understand the ‘why.’
Hook rates and meaningful engagement
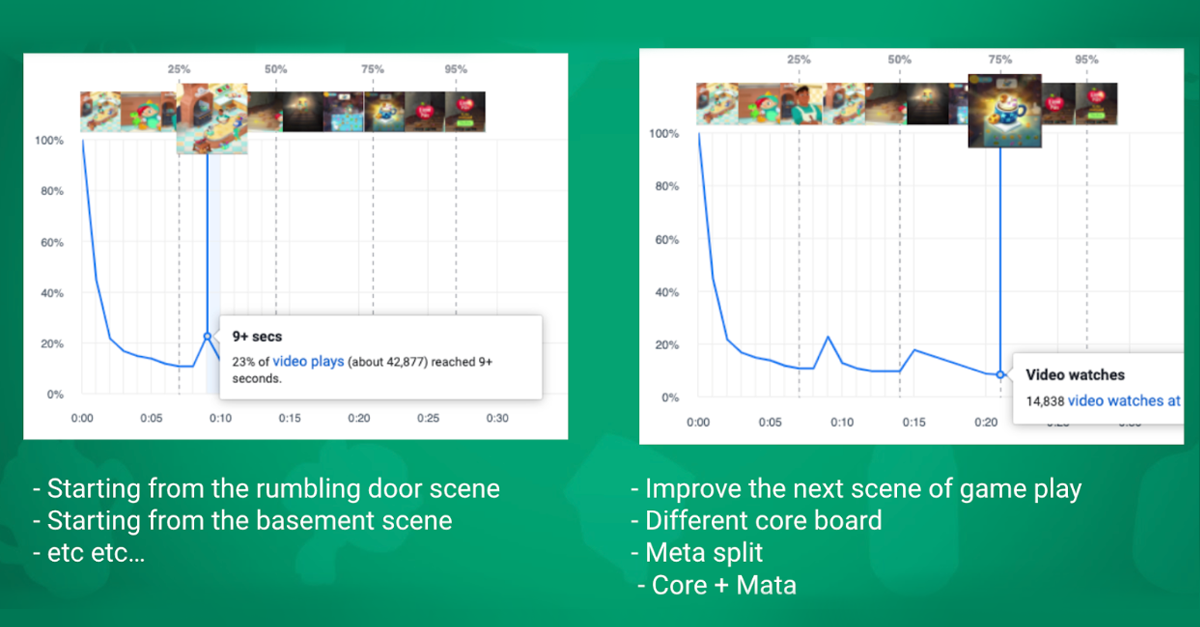
We added two new data points focused on watch times to our creative analysis. First, we took watch time graphs, which compare watch times per video. These show engagement, but also if there are moments of drop-off within videos. This can help us understand where to iterate on a particular video.

We also added a new metric—‘hook rate’ (impressions / 3s video views). Hook rates help compare how well ads hook the user in the all-important first three seconds of a video. This gives fascinating insights—especially when comparing iterations of similar concepts.

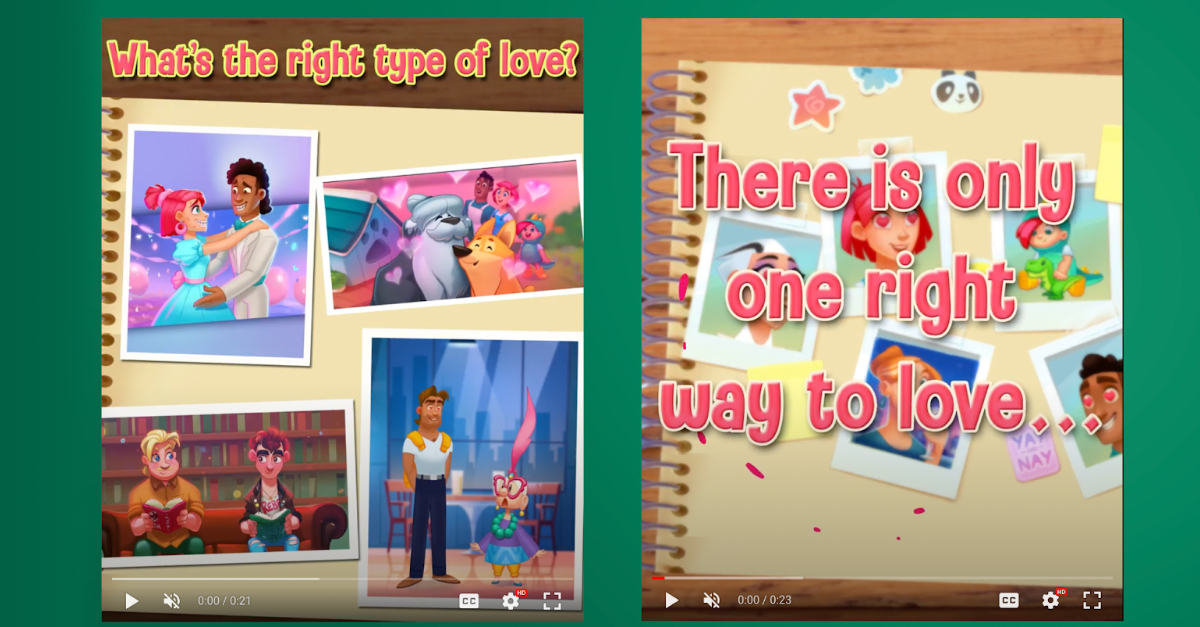
Here’s an example. The videos above show the same images, with almost the same copy throughout. The only differences are the opening layout and the video transitions. In the creative test results, the CPIs were similar—but we saw a significant difference in hook rates. One video had much more meaningful engagement than the other. The differences tell us a lot about video style, animation style, and mechanisms we can apply to other videos.

This video lost in the creative test, but it had the highest hook rate! Despite being the losing video, we gained insights into the themes that work for a strong opening—the cafe on fire, for one. We also learned about why the creative may have lost by identifying slow parts of the ad, segments that may need more clarity for users, etc.
Turning hook rates into creative wins
Comparing engagement with hook rates makes it much easier to pinpoint what an audience likes and doesn’t like. We use the data to identify ideas for iteration. Every month, the UA and creative team sit down and have what I coined a ‘creative retro.’ In these meetings, we go through hook rates, watch times and many other exercises and analyses involving the creative topics outlined above. Using hook rates, watch times, and a set of questions, we generate as many iteration ideas as possible.
The best part is we now gain great insights from videos that failed, which previously had little or no value. Now, we can use it to make new videos even better. This has led to a few nice wins!

In the example above, the picture on the left is the original version, and the right is the optimized version. The initial analysis showed that people were hooked by the question, ‘why are people putting cats in the fridge?’ but dropped off after the text appeared in version A. We decided to make the hook more explicit, so we opened the video by immediately showing cats in the fridge. By doing this, we decreased CPI by 20%.
The creative retro and cross-team collaboration
The creative retro gave our team a better understanding of why something is winning, which puts us in a better position to create winning videos. Beyond that, here are some other amazing outcomes:
- Bringing the UA and creative team together and sharing insights.
- Celebrating creative wins & losses.
- Equipping the creative team with tools to use data and make informed decisions.
- A refined focus on creating ads that engage users.
- Last but not least, it’s a lot of fun!
Feedback from my first creative retro was overwhelmingly positive. Colleagues found it exciting that the exercises turned into unique brainstorming sessions generating iterations and new concepts. It’s fun to think about why things won, especially the unexpected discoveries. Now we have a massive backlog of ideas.
It’s a relatively new initiative, but I hope to keep refining the creative retro over the coming years. I’m excited to see the output and impact of these sessions over time—and, more importantly, to see our ads improve over time.
To sum up, creative tests can tell you what wins, but they won’t tell you why something won—and certainly won’t tell you why something failed. To do that takes investigation, analysis and an awesome team who want to find out with you.