NEW! 2018 Mobile Finance Apps Report
Tax season is upon us here in the US. And with the joy of filing taxes comes the release of the 2018 Mobile Finance Apps Report. While it may not help reduce the stress of tax season, the report is sure to help you with your finance app marketing strategy.
The 2018 Mobile Finance Apps Report equips finance app marketers to make data-informed decisions, ensuring their apps attract users that engage.
 The 2018 Mobile Finance Apps Report draws from Liftoff internal data from February 1, 2017 through January 31, 2018, spanning 8.7 billion ad impressions across 2.6 million app installs, 102 million clicks and 1 million activations and registrations. Inside the report you will learn about the costs and engagement rates associated with marketing mobile finance apps, including:
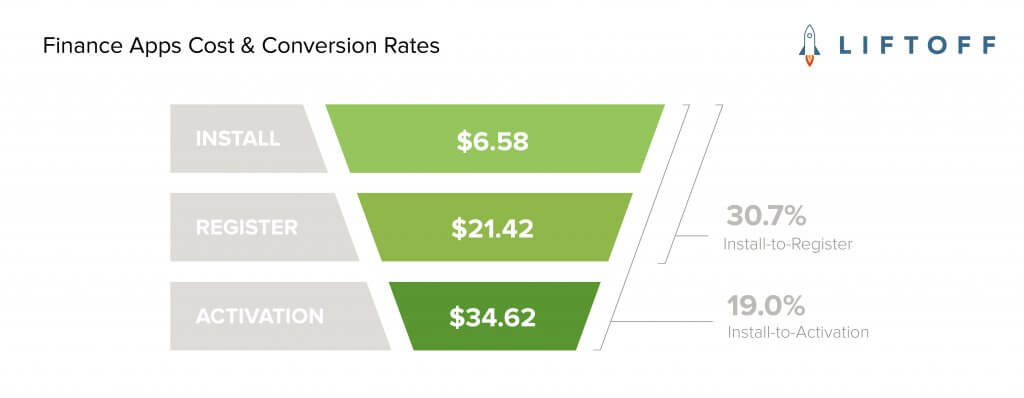
- Finance app cost and conversion rate trends & benchmarks
- Breakdown of data by platform (iOS and Android)
- User demographic (gender) and seasonal trends
- Regional trends (North America, EMEA and APAC)
- Average install-to-registration and install-to-activation times
- A new section on finance app creatives that converts
For an in-depth discussion on marketing finance apps and the data included in the report, watch our on-demand Finance Apps: Trends and Benchmarks webinar.
If you are ready to achieve your finance app user acquisition and re-engagement goals, let’s get started today!